Overview
Our goal for this section of research was to investigate the prediction of strain values for our microstructures at different loading conditions and tensor directions obtained through the Finite Element Method and PyMKS. In this regard, the statistical two-sample Kolmogrov-Smirnov Test was used to compared the cumulative density functions of the two methods. Take for example, the plot below:
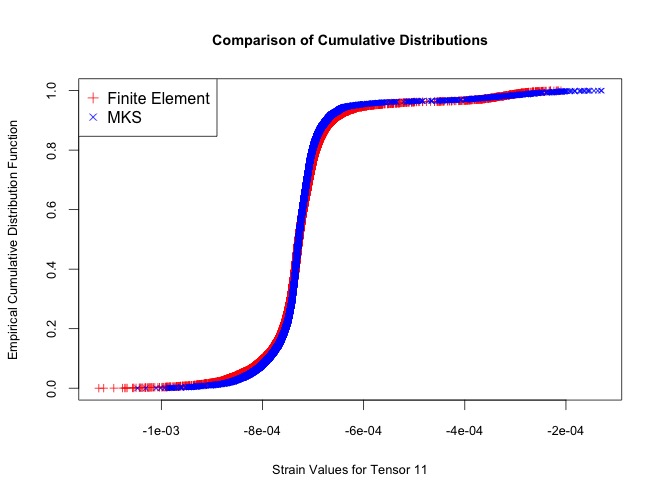 For which visually the two CDFs exhibit the same distribution and numerically, the KS-Test yields a p-value of .00000001816. Hence the two CDFs are statistically equivalent.
Moving Forward The next concept was to bin the strain values based on their Manhattan distance from the particles in each each microstructure. An explanation of this search algorithm and useful gif can be found at the following link: https://en.wikipedia.org/wiki/Dijkstra%27s_algorithm The idea behind this binning was to investigate whether or not a close proximity to the particles being subjected to the strain would cause a statistically significant difference between the strain values produced by the Finite Element Method and the PyMKS method. Our initial assumption was that the closer the value was to the particle, the larger the difference between FE and PyMKS would be. However the p-values found at each distance for the same microstructure detailed above was:
- 0.6058
- 0.1673
- 0.02669
- 0.0181
- 0.01634
- 0.5504
- 0.377
- 0.7869
Where these p-values are ordered with the corresponding Manhattan distances. This unexpected phenomenon was not unique to this specific microstructure, loading condition or tensor orientation. As a result, we decided to move forward with a specific analysis on the magnitude of the difference between the Finite Element Method and PyMKS.