Nematic Materials
Nematic materials consist of anisotropic units that share a preferred average alignment. For example, for a series of nematic rod-like units, they will prefer to align with their long axes pointing in roughly the same direction. We call this direction the director n, a bivector, as seen in the example in Figure 1A. Defects in nematic materials occur when the director is undefined. For nematics confined to a two-dimensional surface, the two most common defect structures are the and defects, as seen in Figure 1B.
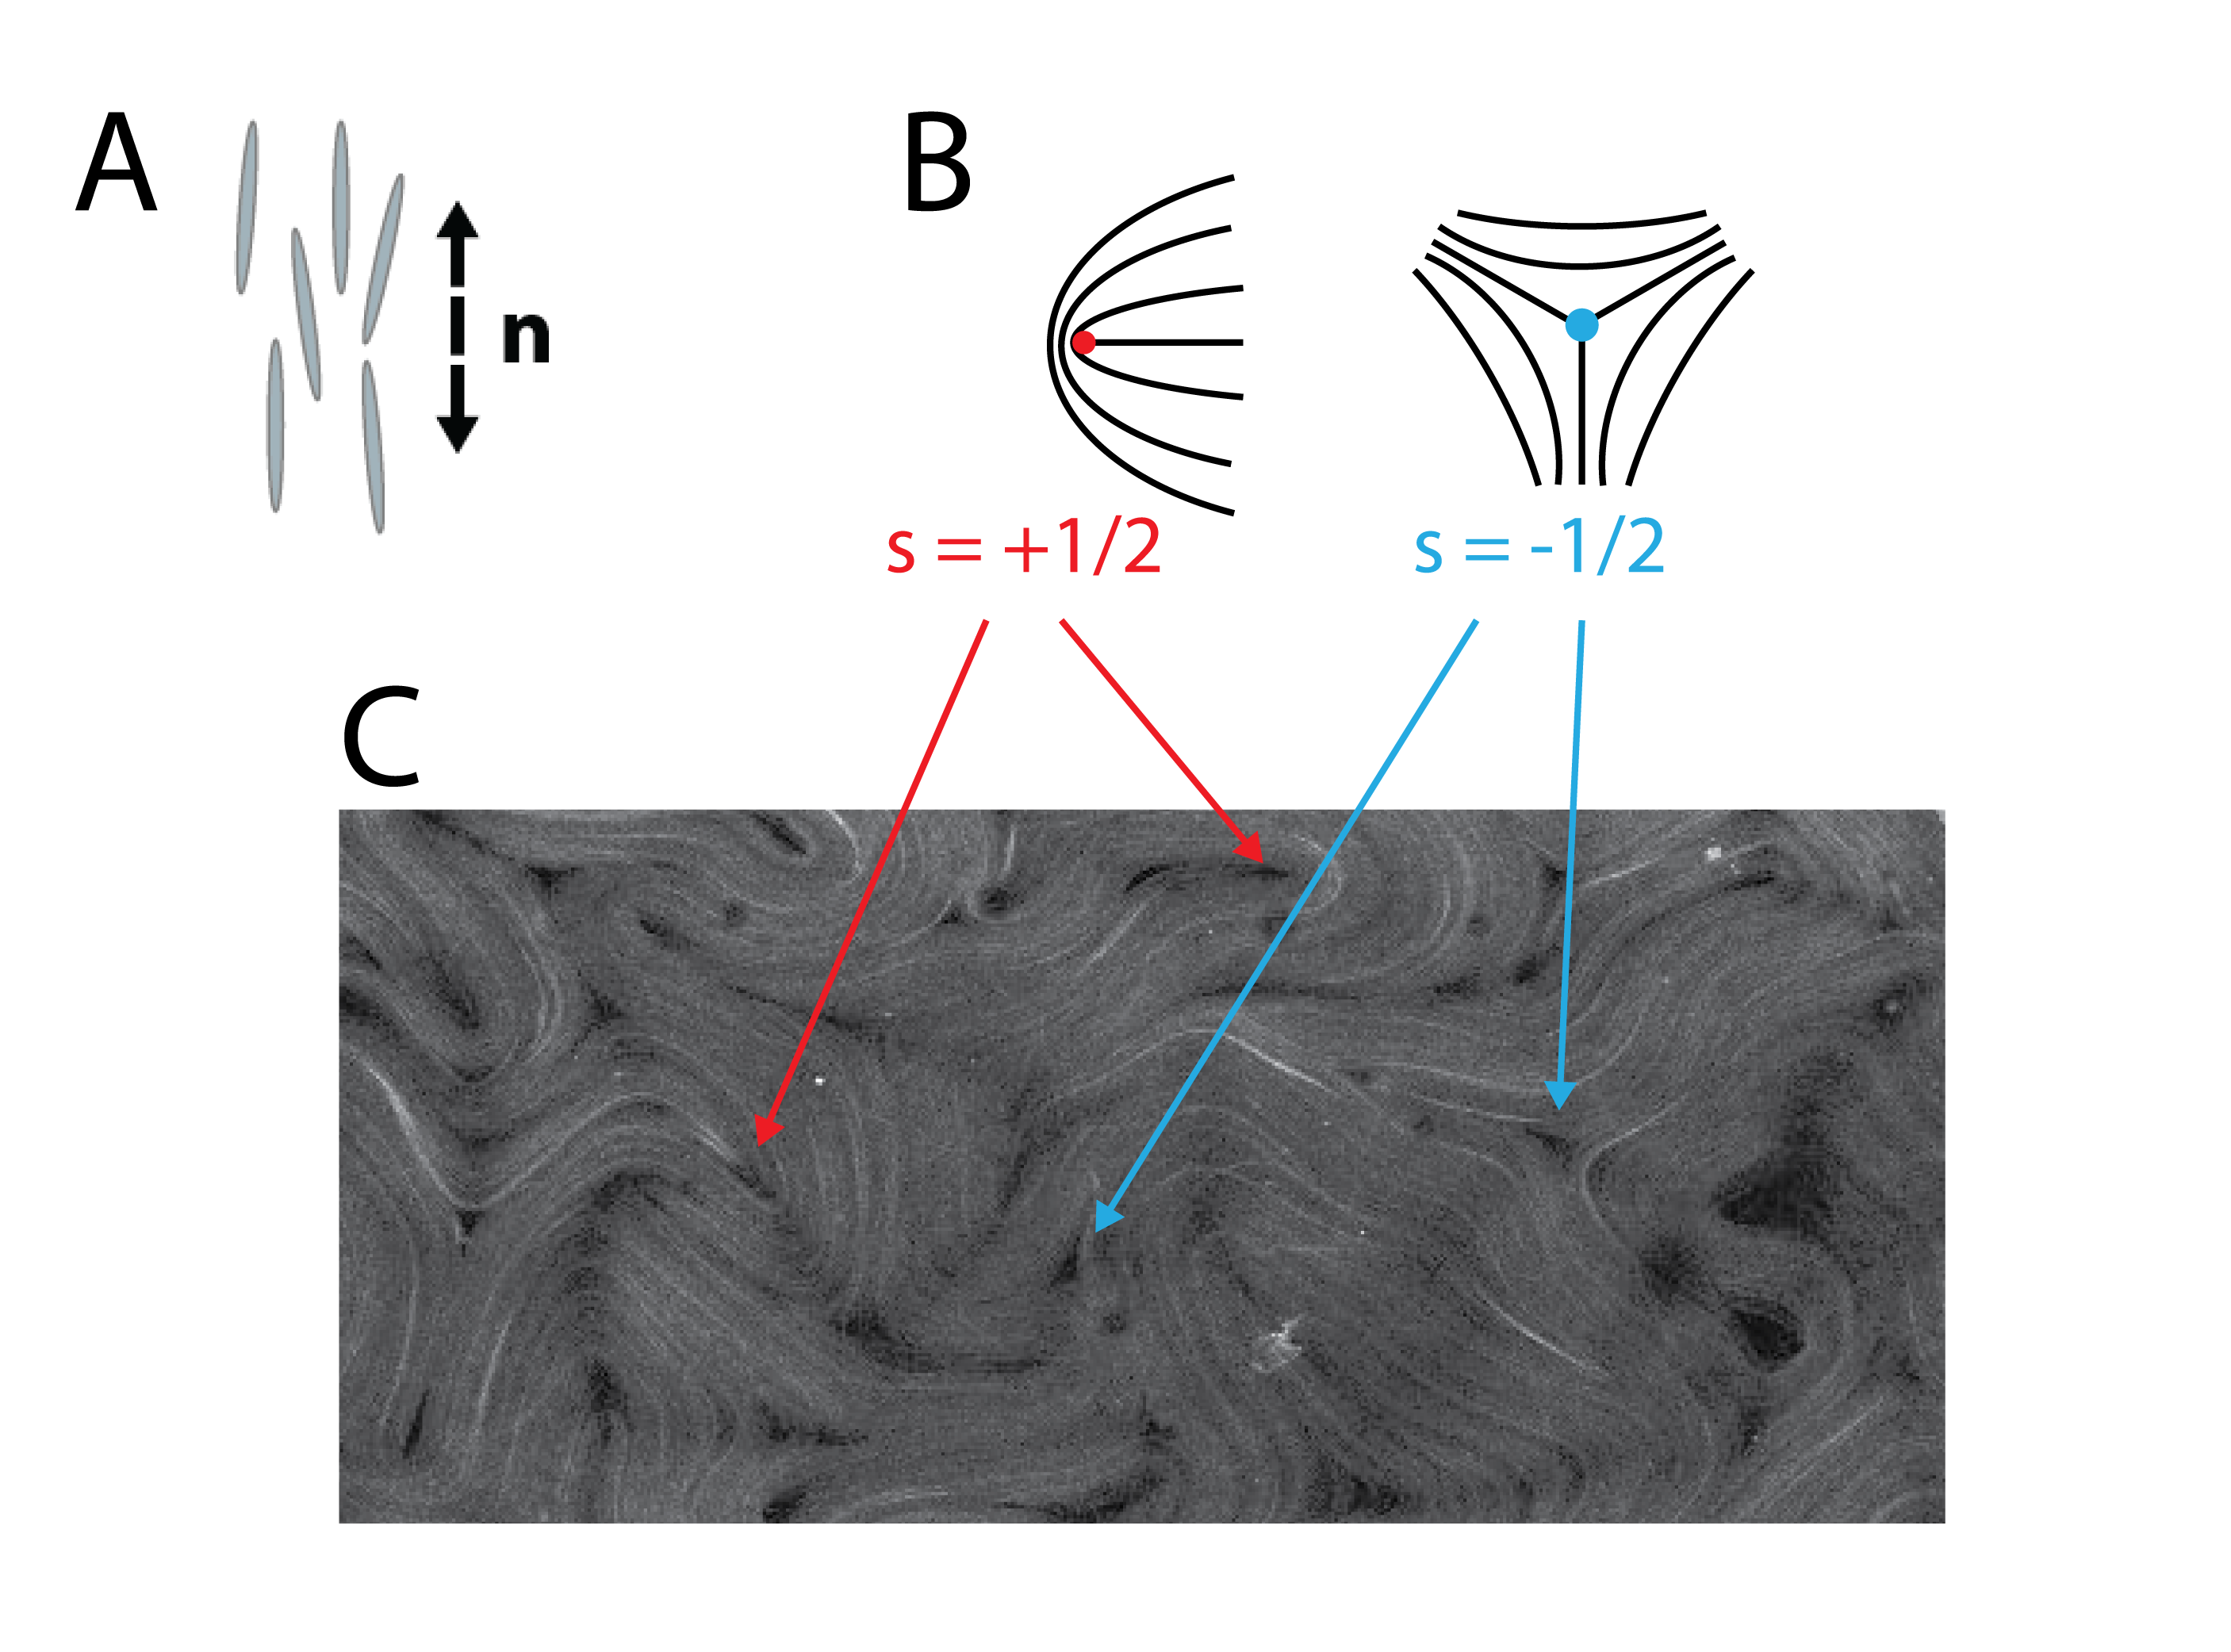
Figure 1: A, schematic showing nematic alignment and the director. B, schematics showing the director configurations for +1/2 (left, red dot) and -1/2 (right, blue dot) defects. C, snapshot of an active nematic with some +1/2 and -1/2 defects highlighted.
While the most commonly known nematic materials are the equilibrium nematic liquid crystals used in liquid crystal displays (LCD), we are going to be analyzing data from an active nematic. In this case, the individual units making up the material have a source of internal energy that can be converted into motion. This motion continuously drives the material out of equilibrium and creates a sea of defects. A snapshot of this material with some positive and negative defects highlighted can be seen in Figure 1C. The activity is responsible for creating the “sea” of defects in the image. A similar image for an equilibrium material might show the director primarily aligned along a single direction with perhaps only a few defects present.
Active nematics on the surface of a torus
While the properties of active nematics on a flat surface still have many interesting properties, we will be looking at an active nematic confined to the surface of a torus. This lets us probe the influence of curvature on the arrangement of the defects. The data are taken on a confocal microscope. A confocal microscope is capable of imaging in three-dimensions; the data are a “z-stack” of two dimensional images, each corresponding to a slice through the sample at a given height. A video scanning through the z-stack and the reconstructed surface can be seen in Figure 2.
|
z-stack |
reconstructed image |
|
Figure 2: Left, video scanning through a z-stack. Right, video showing the data reconstructed from the z-stack. |
Goals of the project
As stated earlier, we are looking to see how the curvature of the surface affects the behavior of the active nematic. We have z-stack recorded over time of different active nematic toroids. An example video of a small portion of a torus is shown from below the torus in Figure 3. We want to locate all of the defects in all of the images such that we can determine quantities like defect trajectories, defect lifetimes, defect orientations, defect velocities, etc. all a function of the local curvature.
|
example active nematic data |
Figure 3: A short video showing the active nematic evolving with time. This is a small view of the tube of the torus from below the torus.
By connecting the curvature to the behavior of the defects, we hope to gain insight onto how not only nematic materials react under confinement, but also how materials with other types of order interact with the curvature of the substrate.