This post describes the PCA approach applied to our dataset and determination of principal components of the variance that will be later linked to polynomial combnations of processing parameters: T, X/XY, V, W, D, L, HAZ. Models of the P-S linkages are derived from the data set so PCA of the 2 point statistics data has to be done on no less than the entire microstructure ensemble available.
The task of gathering and organizing the microstructure and process parameter data is not yet complete for the entire data set. Automating the procedure is proving to be a small challenge and at the moment PCA of the entire ensemble is impossible. Instead a small segment of the data set consisting of six handpicked microstructures was manually extracted and processed for a preliminary PCA demonstration.
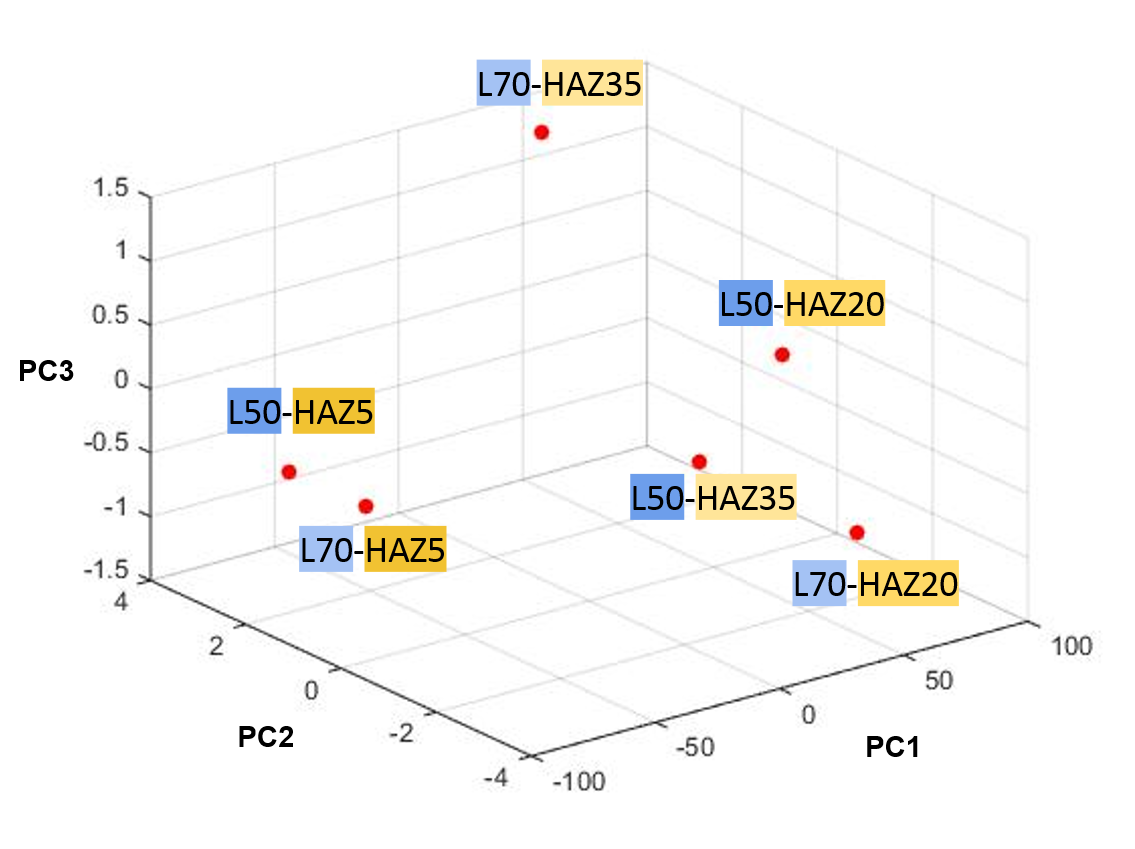 Fig.1. PCA of 2 point statistics collected for 6 datapoints.
The axes display the first three principal components and the points are color-coded to represent specific parameter combinations. The image below indicates the color-code.
Fig.1. PCA of 2 point statistics collected for 6 datapoints.
The axes display the first three principal components and the points are color-coded to represent specific parameter combinations. The image below indicates the color-code.
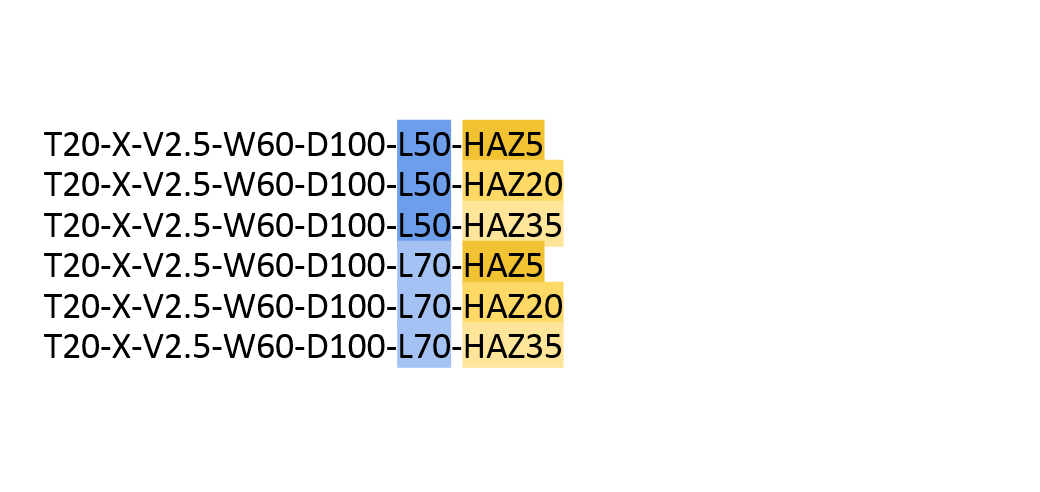 Fig.2. Color designation of parameter combinations of 6 data points.
Memory is a consideration in extending this approach to the entire ensemble. Each 2 point statistic is about 50MB of memory. In the process of determining the variance and principal components of the data set the algorithm will hold the entire 2160 set in RAM, necessitating the use of a computer cluster. Georgia Tech’s PACE system will be used to accomplish this task.