Executive Summary
Almambet Iskakov, Robert Pienta
Dec 05 2015
Project Objectives
Create a model linking our simulated process data with a representation of the steady-state microstructures. Further detail on each step to achieving this objective is provided below (in summa) and in greater detail in our posts.
Description
Our data is a product of a phase-field simulations on the microstructure evolution in directional solidification of a aluminum-silver-copper ternary eutectoid alloy. The data consists of 21 datasets, while each dataset contains the microstructure information through time, from beginning of simulation to steady state. The simulations include varied concentrations and solidification velocities, but the same initial microstructure. The data was provided from Karlsruhe Institute of Technology in Germany to Georgia Tech for collaboration.
Dataset
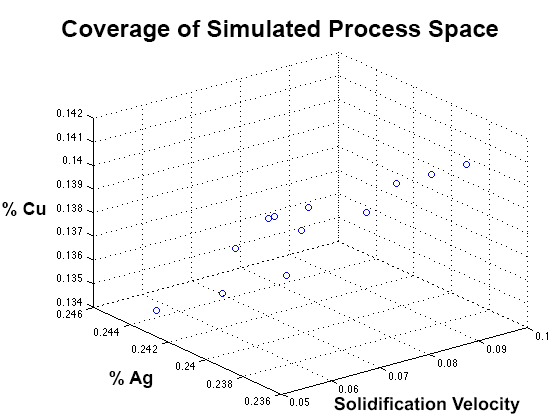
The data consist of 21 simulation results datasets, each dataset is 301 microstructure images with 800x800 pixel resolution. For each simulation, the concentration of Al, Ag, and Cu, and solidification velocities is specified. The microstructure image data is can be characterize in the following way 21x301x800x800 in terms of pixel information. Below is a plot of the simulation process parameters:
Microstructure representations of various datasets with different process parameters.
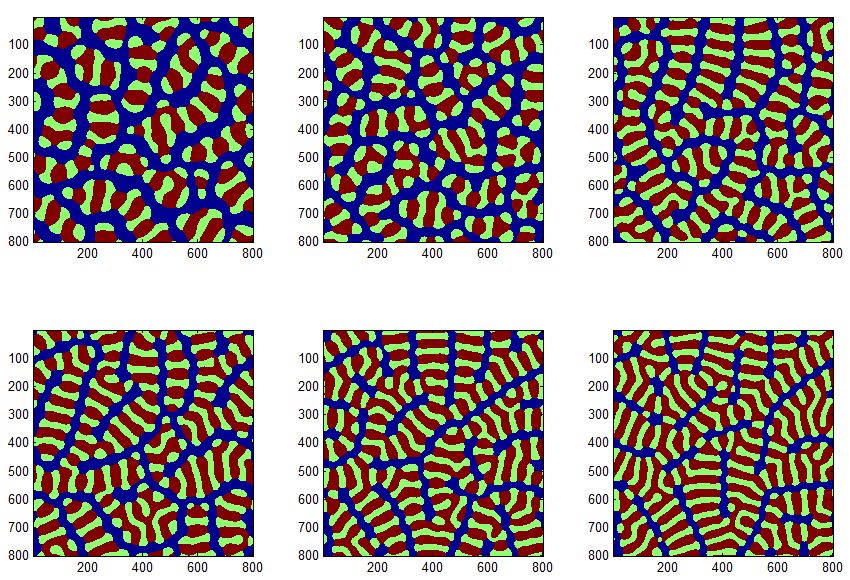
The microstructure consists of 3 phases, Al, Al-Ag, and Al-Cu. Below is an amination of one simulation dataset evolving through time.
- Al = Green, Ag2Al = Orange, and Al2Cu = Blue
Collaboration
Almambet comes from the Mechanical Engineering department, while Robert comes from the Computational Science and Engineering department. Robert coded most of the Python analysis for spatial correlations, dimensionality reduction, and linkage model. Almambet coded in Matlab for spatial correlations analysis and linkage model.
We had useful discussions with Dr Kalidindi, Yuskel Yabansu, and David Brough on our project throughtout the semester.
Challenges
There were fewer process (input) variables into the simulation than we expected, which would be helpful in creating a robust process-structure model. There are only two process parameters that were available to us: concentration and solidification velocity. Since concentration of Al was always constant, concentration of either Ag or Cu would be sufficient to know the concentration of the whole material.
At the beginning of the project we were expecting a large set of data based on the simulations metadata. However, as the semester progressed, we realized that our data was capped at 21 datasets. And since these simulations were performed by collaborators at Karlsruhe Institute of Technology in Germany, we were limited to what received.
2 Point Statistics
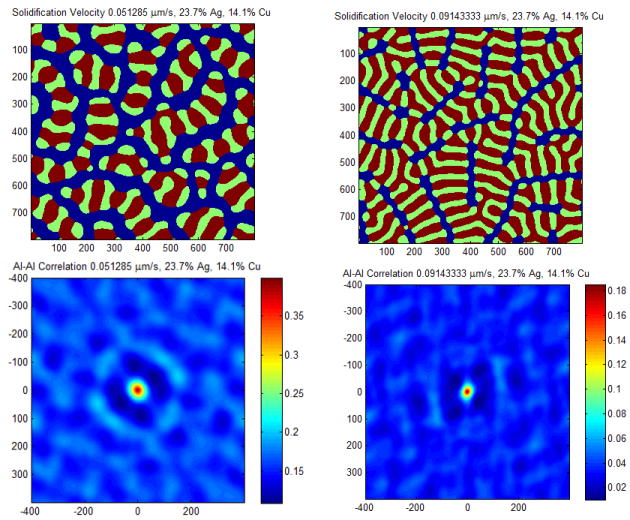
We extracted 2-point spatial correlation statistics for our data. We assumed a periodic boundary condition for both the x- and y-axis. These statistics will become the per-sample measurements we reduce via PCA. We utilized pyMKS for our pipeline. The following figure shows a single visualzed spatial correlation:
2 Point Statistics Optimization
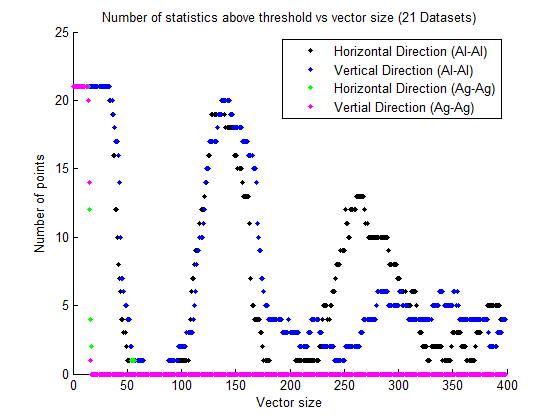
Each 2-point statistic is an 800x800 field showing phase-phase correlations. Not all of this region is likely to be statistically meaningful, so we investigated which resolutions of 2-pt statistics offered a good balance between computational speed and accuracy. The truncation is done symmetrically, which is consistent with a our periodic assumption.
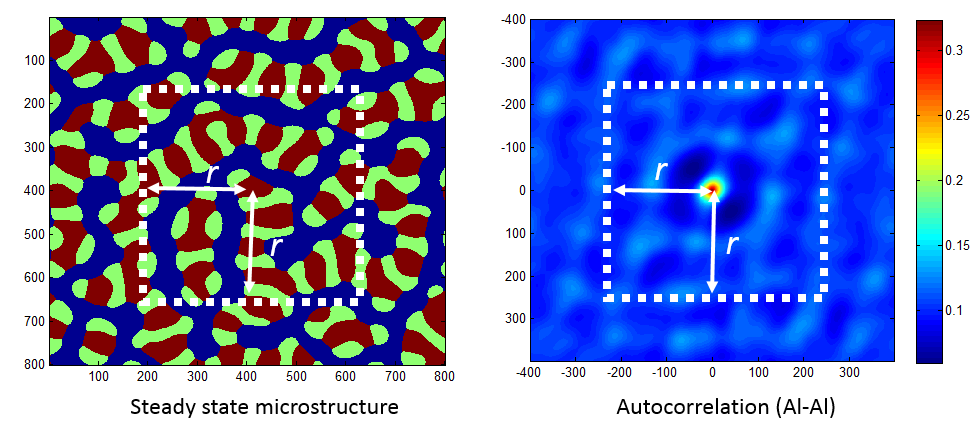
The following plot demonstrates the amount of statistically significant measurements in the cut region.
Principal Component Analysis (PCA)
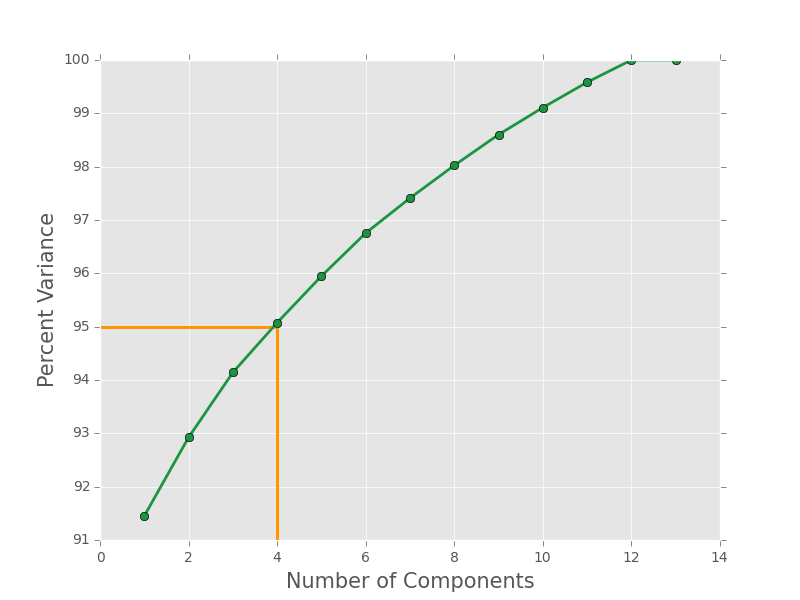
We used PCA to reduce the large 2-pt statistics to a low rank representation. Our data exhibit reasonable variance falloff; demonstrated in the following cumulative Scree plot.
PCA Optimization
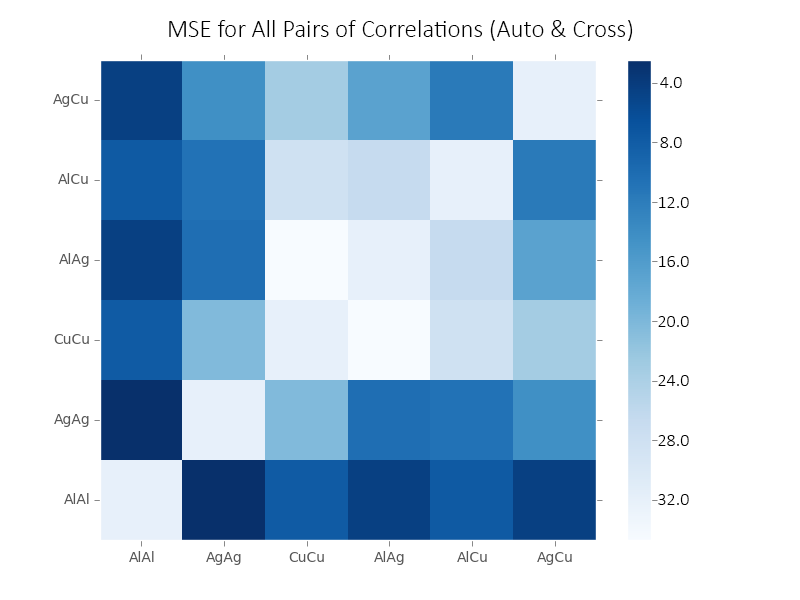
We also investigated which pairs of correlations perform best with our entire pipeline. Since we have only three phases, we know that the entirety of the correlations can be calculated from two of them. We chose to run the pipeline for all pairs of correlations and use the pair with best final model performance (minimal MSE). using Al-Al correlation was mandatory since it is the main element in the material and also the most continuous phase. The second best correlation, based on MSE, turned to be Ag2Al-Ag2Al.
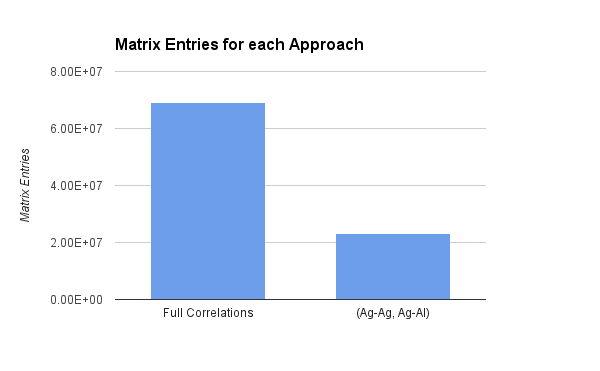
Reducing the input to only two spatial correlations (vs. 6) is a huge space savings for the PCA step.
Final PCA Results - Steady State
PCA components of a single simulation over time:
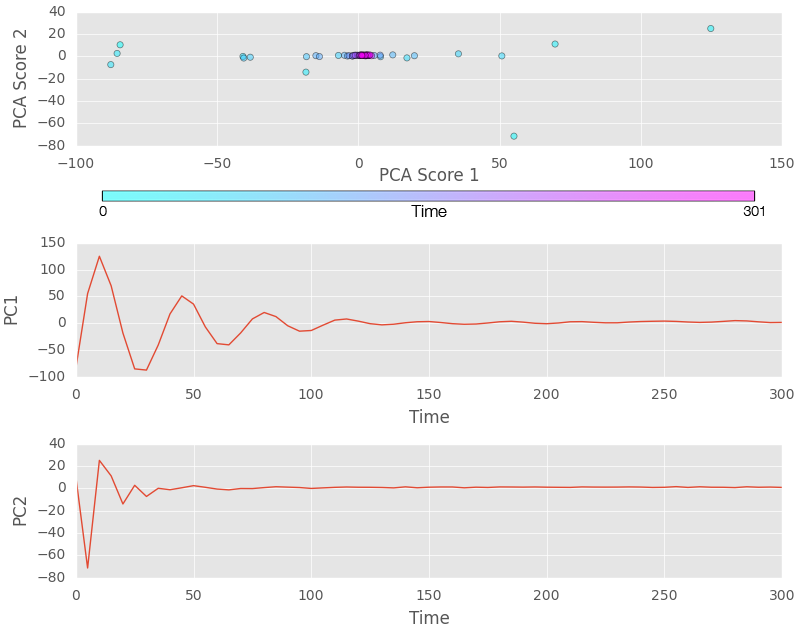 Wild oscillations occur in our data until about 150 time steps. For our steady-state investigation, we do not use any of the microstructures in the first 150 time steps, we wait for this period so that oscillations in PC1 and PC2 are miniscule, representative of a steady-state condition.
Process-Property Linkage Model
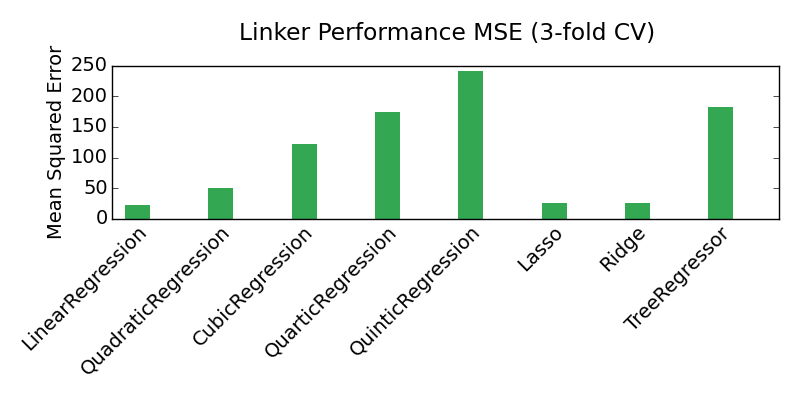
We tried multiple models to predict the linkage between process parameters and 2-point statistics.
Here are the final MSE scores for several optimized models.
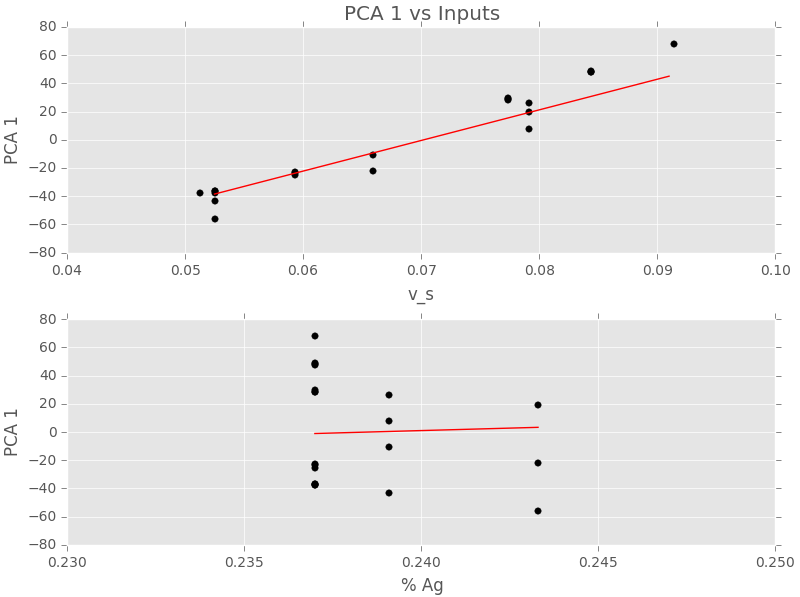
 Here’s an linear model fit two the first two PCA scores.
Exploring Transient Data
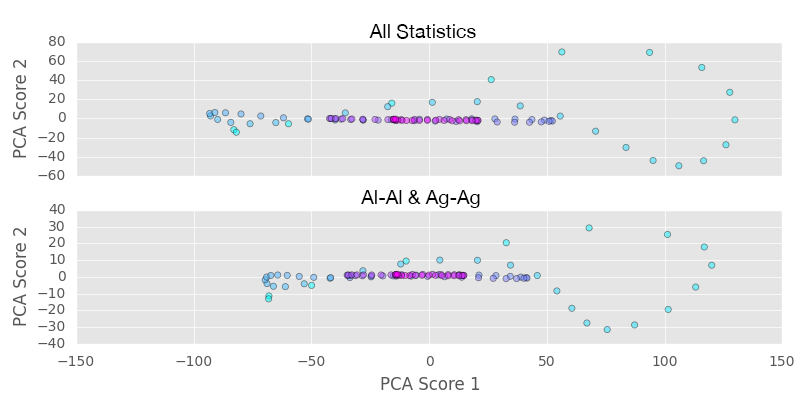
We performed the same 2 spatial correlations and PCA on our transient data, which we limited to first 100 time steps. In the below PCA plot for one simulation dataset, we see that initially PCA scores vary highly (color gradient as above plot). With time, the PCA scores approach a steady state in regions between time 100-120.
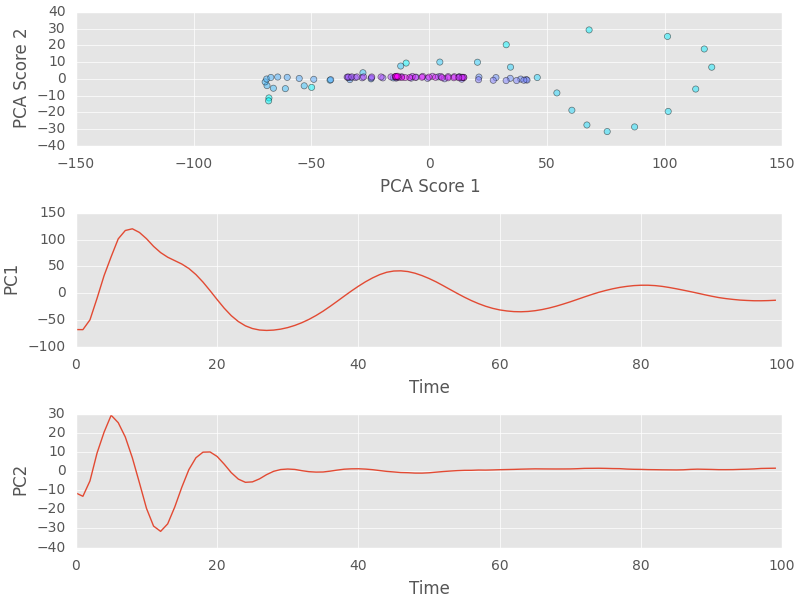
We also compared PCA results using all 2-pt spatial correlations and only two (Al-Al, Ag2Al-Ag2Al). PCA scores follow the same trend. There is some scaling in the PC1 and PC2 scores, with PC1 affected very little. Since PC1 contains more than 90% of the variance in the data, we decided that using only two spatial correlations is sufficient. Reducing the input to PCA in transient data is important to keep computing cost reasonable, since each dataset now contains 100 times more data than steady-state investigation.
Summary
This project is a great step towards continued collaboration in creating PSP linkage for ternary Al-Ag-Cu alloys. A data-science approach was used to model the process-structure relation. Considering this is a new and ongoing study, there is a wide range of possible studies as more simulation studies are performed. In the near future, we hope to include including transient response to create a more comprehensive model.
Acknowledgements
We would like to thank Dr. Surya Kalidindi, Yuksel Yabansu, David Brough, and Ahmet Cecen.