The purpose of this new blog post is to brief our readers regarding a slight modification we are doing to the way we are analyzing the chord length distribution from the results of our simulations.
In a previous post it was described the algorithm used to extract the chord length distribution from the results of our simulation. In that post it was stated that we will obtain the chord length distribution in the 3 orthogonal directions, then proceed to take the average and then use that data for the dimensionality reduction.
Well it turns out this approach is only useful for the case that the distribution of the precipitates is completely random, since the histograms for the 3 directions will directly overlap over each other, nevertheless in the case of other distributions, like uniform or the recently added rolling distribution, this approach does not work. The main reason for that is that in this new cases the placement of the precipitate varies from one direction to another, hence it is not isotropic anymore, thus giving different histograms in each direction. Consequently the first modification to our chord length distribution algorithm will be to not use the average for the PCA.
The second main modification made to our chord length code was that instead of considering the count of chords we need to consider the frequency of chords, thus normalize our data by dividing it by the number of chords. This should have been done from the beginning since it is a standard thing to do when performing a statistical analysis, nevertheless we overlooked it so at this point we fixed it.
Now this distribution tells us the probability of a certain chord length to be found in a micro-structure. Nevertheless from this distribution it can also be obtained the probability density, which will tell us the probability of a determined voxel in the micro-structure of belonging to a chord of length “X”. Both distributions give insightful data about the micro-structure, nevertheless for our case it is more useful for us to use the probability density distribution than the probability distribution. The justification for this is detailed below.
Assume you have a micro-structure image of 100x100 and you want to obtain the chord length distribution of the grains present in that image in the “x” direction of that image. The issue is that a chord length of size 2 has 20,000 opportunities to occur, whether a chord of size 100 only has 100. Thus if the longer chords are considered to be much more representative of the micro-structure average grain size just obtaining the frequency of those chords will not suffice. Since just by probability a smaller chord length will occur much more times than a longer one and since the smaller chords are not representative of the microstructure this issue needs to be addressed.
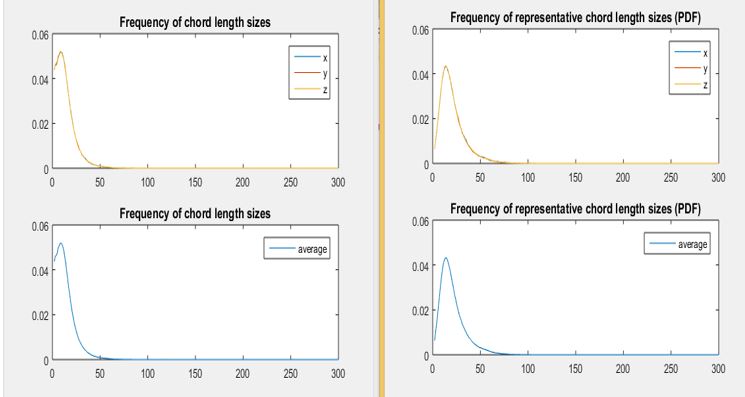
The way we dealt with this challenge was that we multiplied the frequency of each chord by its size and then divided by the total sum, so that the area under the curve is equal to 1. With this normalization the size of the chords is taken into account by assigning a bigger “weight” to the chords of longer length.
The result of applying this normalization is observed on the plots below:
As it can be observed from the plots the normalizations “shifts” the plot to the right as well as now it does not start with a sharp peak as observed on the plots on the left. Therefore this normalization now gives yields a much more insightful information regarding the crystal size distribution of the simulations, consequently this is the one we will be using to perform PCA on.
This plots are generating considering one voxel bins per chord size, nevertheless if desired we could bin together various chord sizes, this would be done with the goal of obtaining a smoother curve. At this point we will not implement that so we will perform PCA on the size normalized chord length, please be on the lookout for the post detailing the PCA result analysis.
