Pinned Grain Growth Progress Report Presentation IV
Fred Hohman, David Montes de Oca Zapiain
Mon, Nov 23 2015
Outline
- Meeting with domain experts outcome
- Image segmentation revisited
-
Chord length distribution expanded
- PCA input plots
- PCA output plots
- Preliminary regression results
- What’s next?
Outcome from Meeting with Domain Experts
-
Meeting with a computational scientist in the area of multiscale modeling @ Sandia National Lab.
-
Extremely useful meeting after which we added 2 more classes to the current simulation pool we had before.
Images of New Classes Added
Rolling:
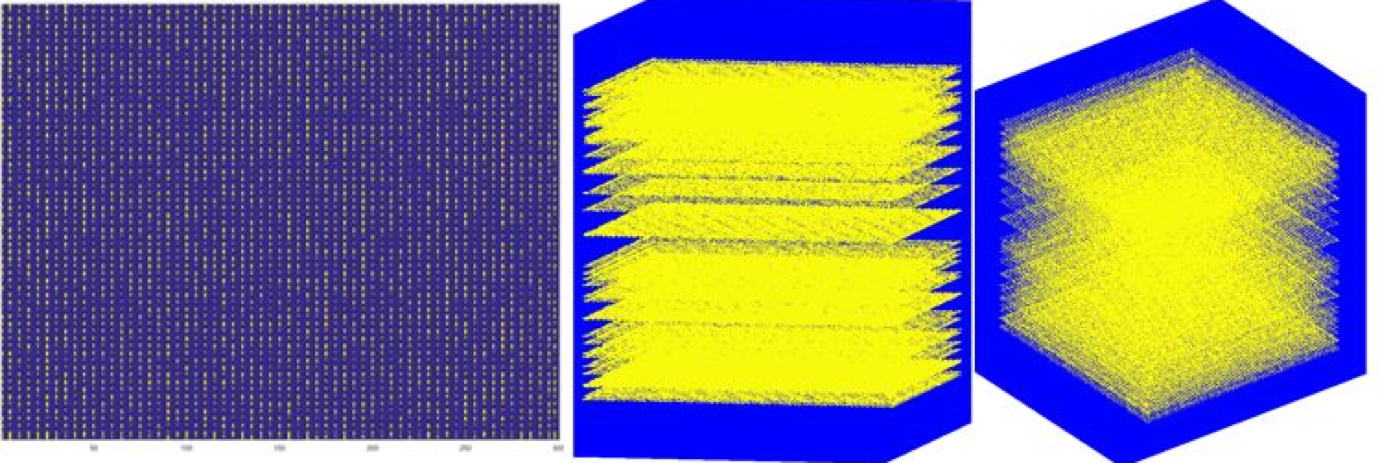
Images of New Classes Added
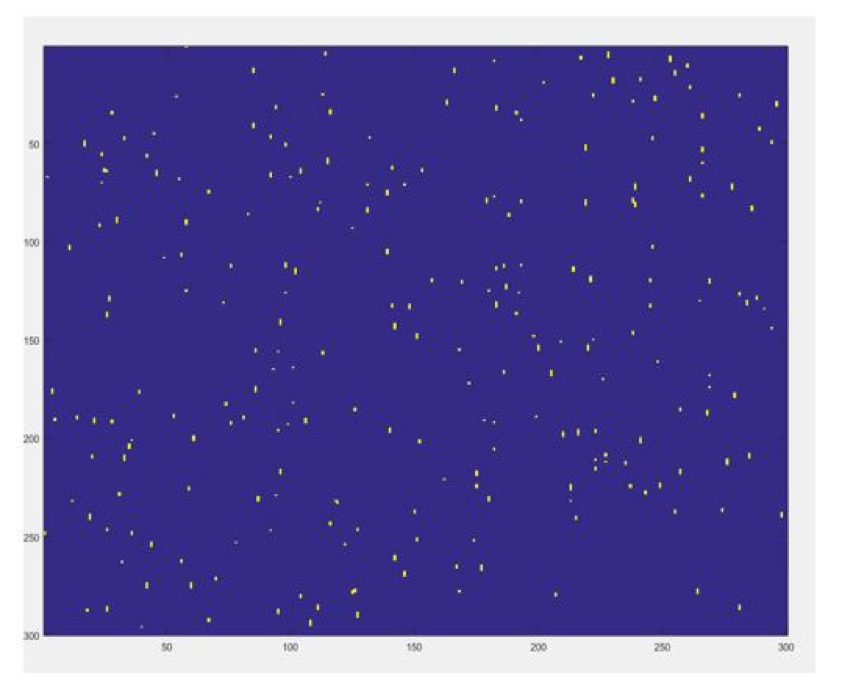
Random Distribution with Random Shapes:
Obtaining Grain Boundary and Precipitates Revisited
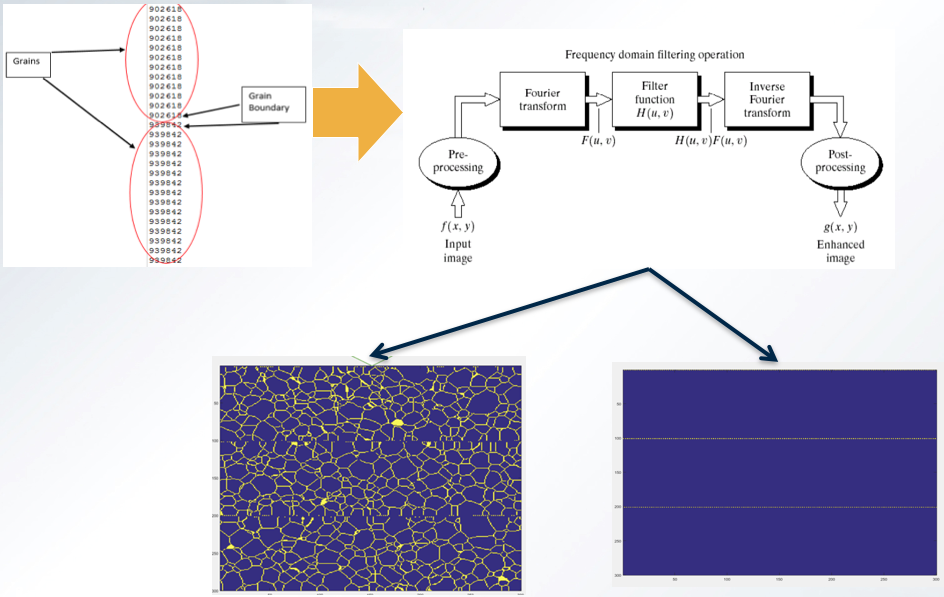
Obtaining Grain Boundary and Precipitates Revisited
- Image of old image segmentation algorithm
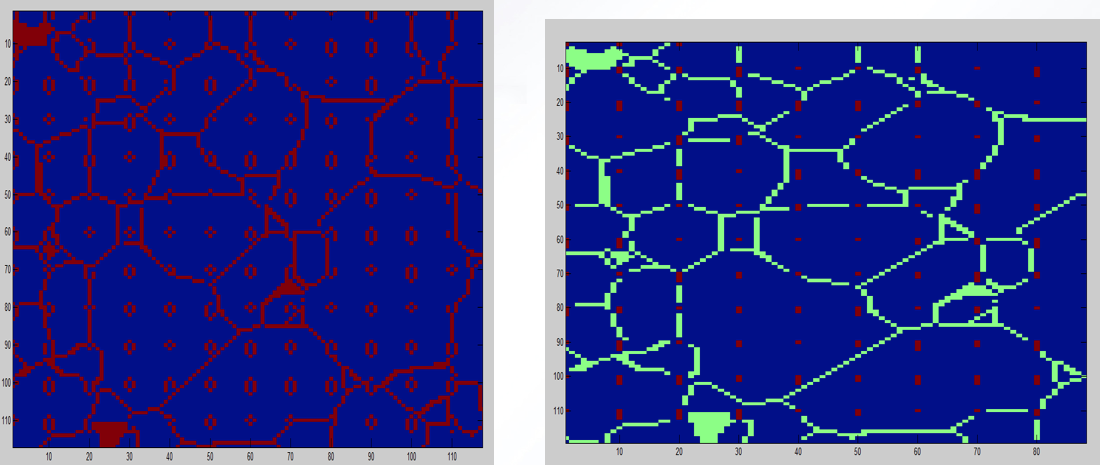
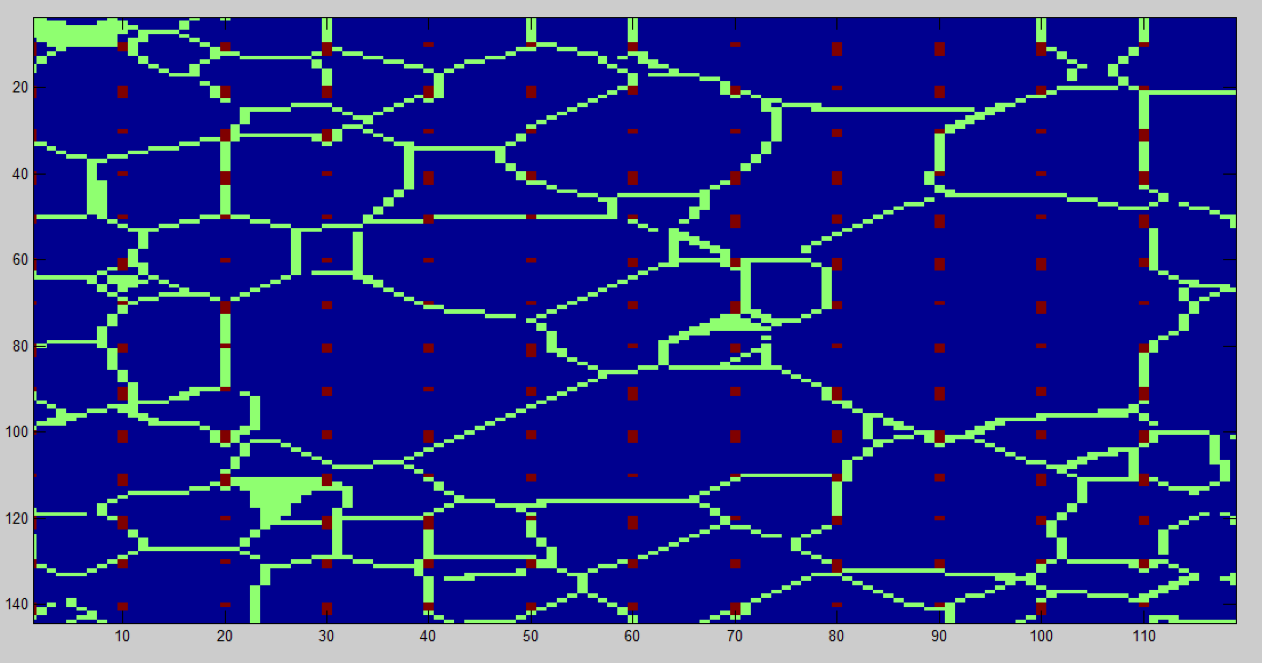
Obtaining Grain Boundary and Precipitates Revisited
- Image of new image segmentation algorithm
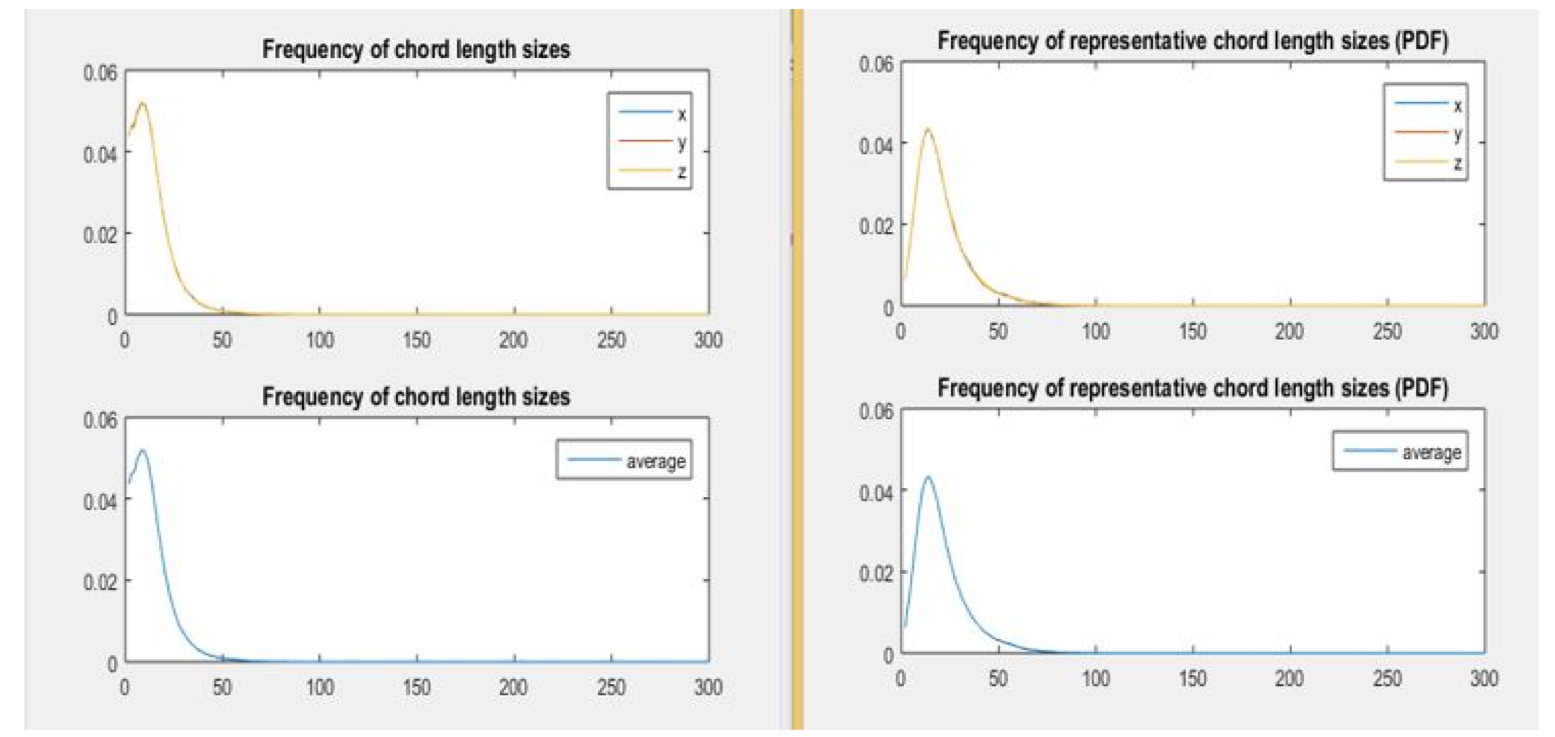
Chord Length Distribution Extraction Expanded
- First decided to not use the average Chord Length distribution.
- We normalized the distribution such that the area under the curve is equal to 1.
- At this point this chord length tells us the probability of finding a chord of length “X” within our MS, nevertheless it is not enough.
- We needed to add something that accounts, “weighs” more the chords of bigger size.
Chord Length Distribution Extraction Expanded
- Thus by multiplying the frequency of each chord by its size and normalizing it again, the bigger chords now have a “bigger weight” in the distribution.
PCA Input
- PACE job using 64GB of memory
- Data matrix size (
n_simulations,27000000) wheren_simulations=220 - 220 is the total number of simulations we were able to perform during semester
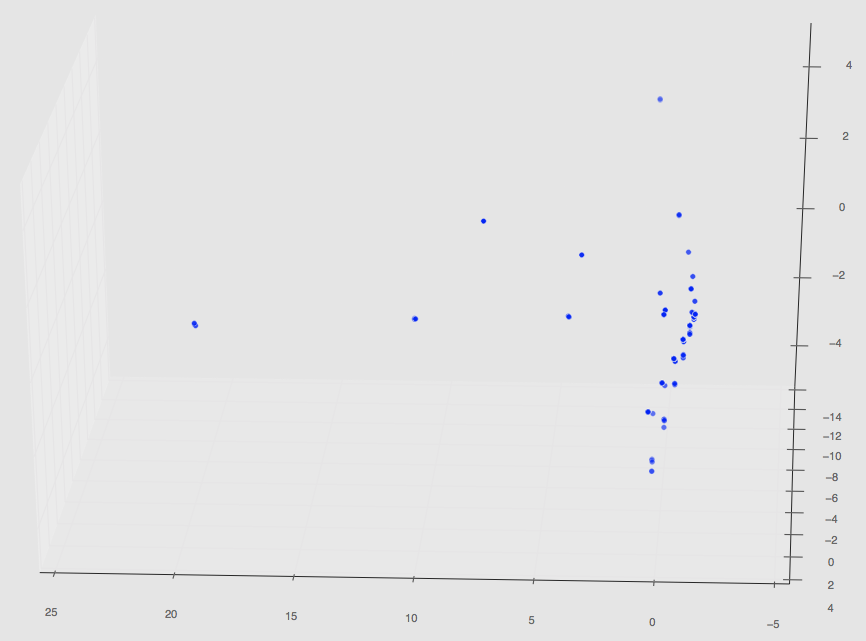
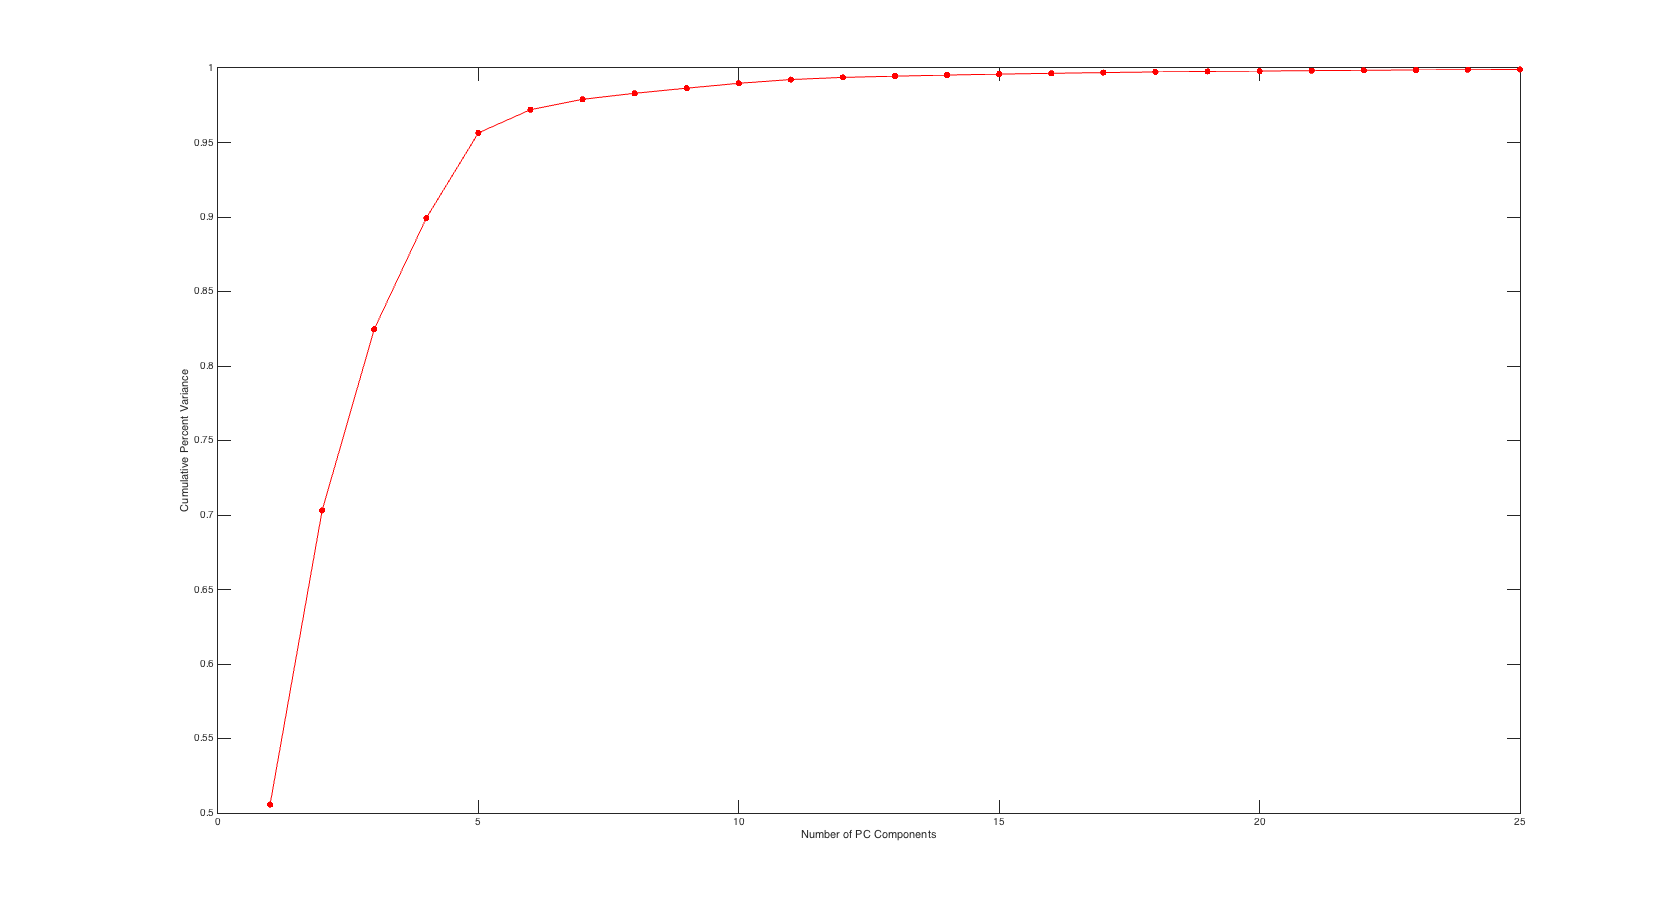
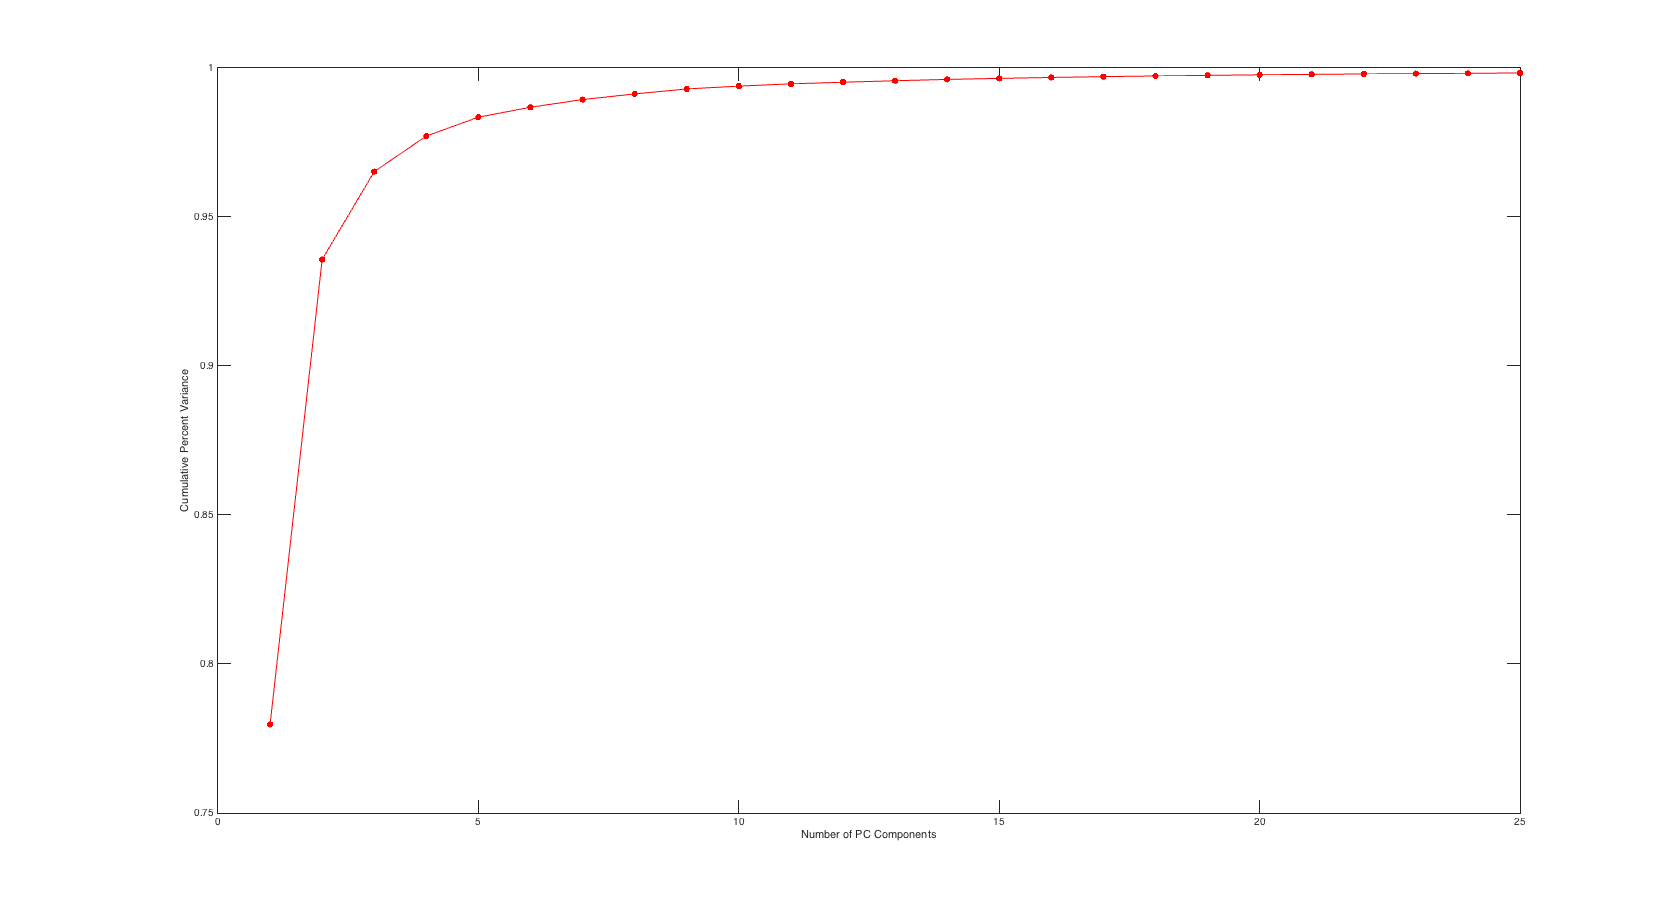
PCA Input Screen Plot
- More than 95% variance captured in first 5 PC values
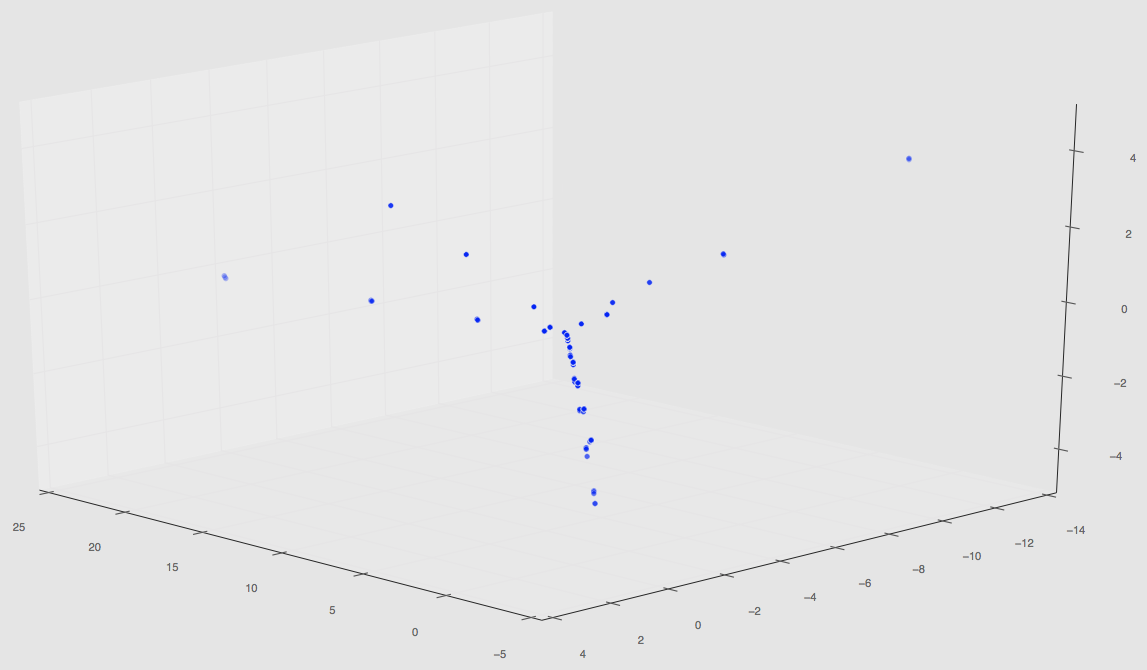
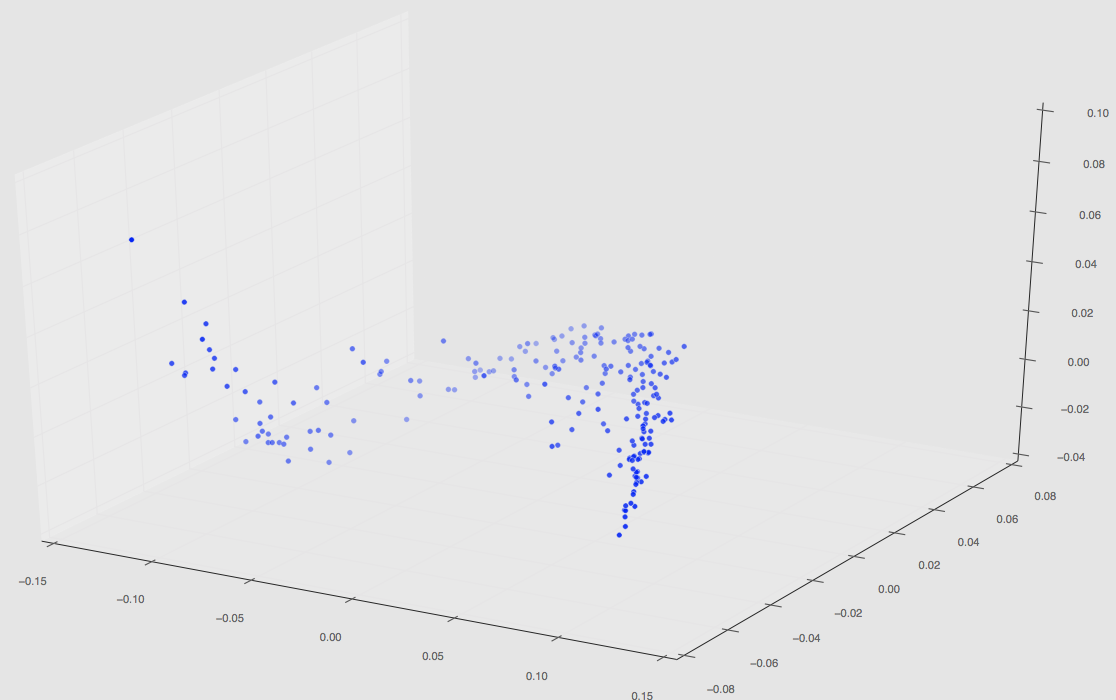
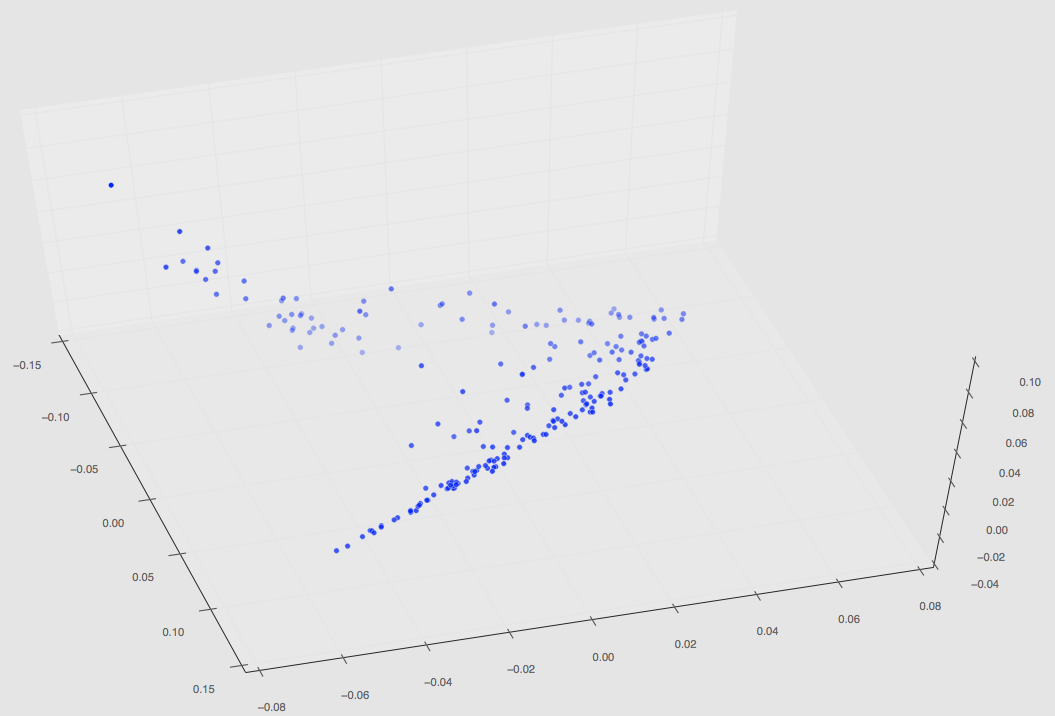
PCA Output
- Chord length distributions (in general) cleaned up after new segmentation code
- Data matrix size (
n_simulations, 299) wheren_simulations=220
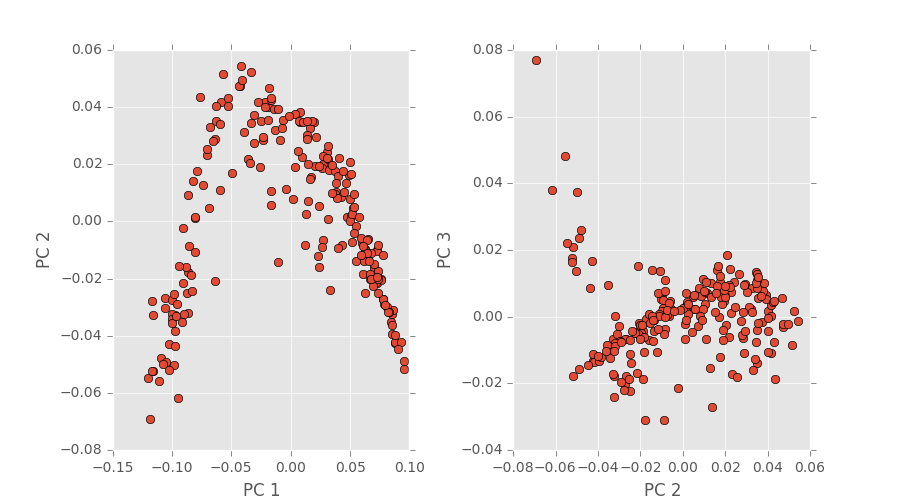
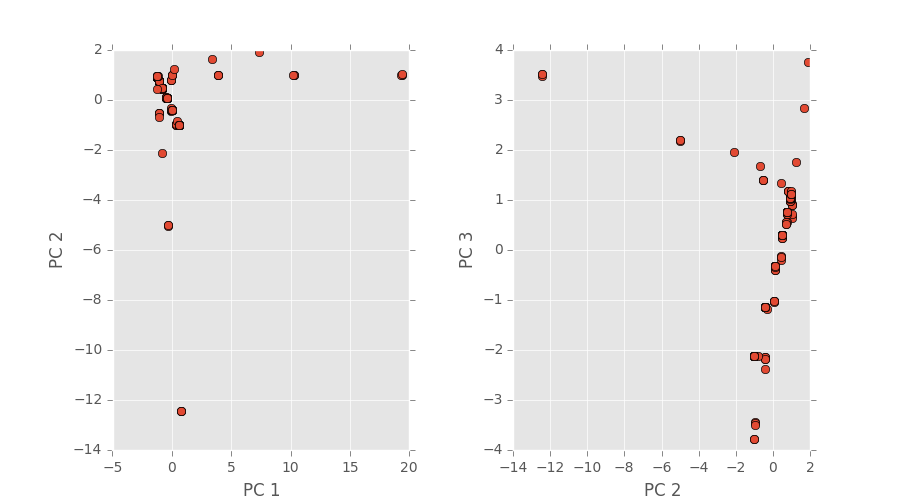
PCA Output Screen Plot
- More than 95% variance captured in first 3 PC values
Regression Test
- We now have two
.mfiles containing our PC values for both the inputs and outputs of our model - Used “hacked” Scikit-Learn/PyMKS module to perform linear regression on our PC values
- Objective: predict chord length distribution given a new precipitate distribution
- We can calculate the
R-squarevalue for a give combination of polynomial degree and number of PC values used- Can create plot showing all combinations of a given set of values in
degreeandn_components
- Can create plot showing all combinations of a given set of values in
(Thanks David Brough!)
Regression Test
- Using all simulations (220)
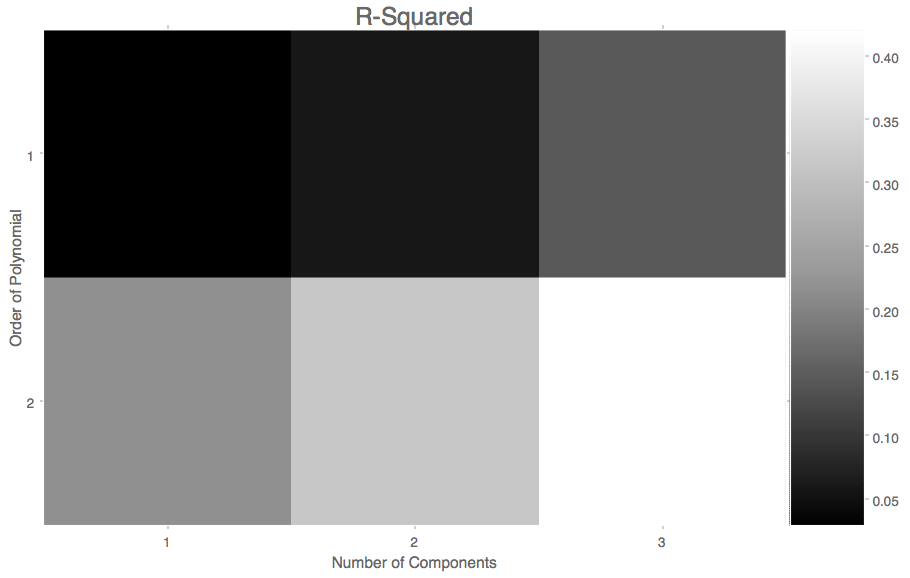
Regression Test Results
- Order of Polynomial: 2
- Number of Components: 3
- R-squared Value: 0.708516065498
Next Steps
- Further analysis on selecting input and output of our model
- Improve process-structure linkage