Bi-variate plots
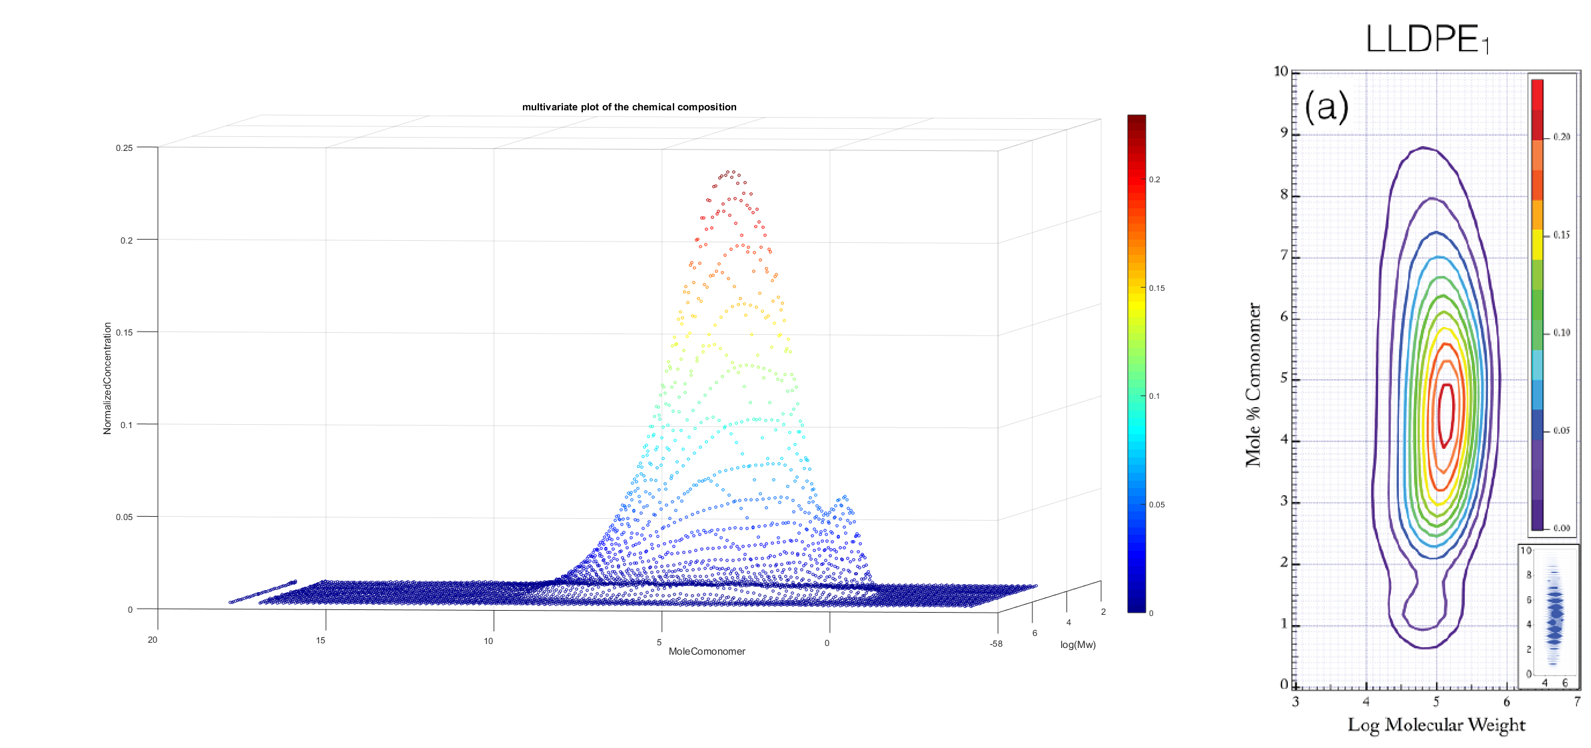
The bivariate distributions of the three polymers is obtained by cross fractionation(CFC) enabled by an instrument that fractionates a polymer sample according to crystallinity and subsequently measures the molecular weight distribution of each fraction. These distributions were measured for 3 types of polymers that we will call here LLDPE 1, 2 and 3. These 3 types of samples differs by the process conditions. These bi-variate plots simply contains information about the molecular compositions of the polymers (molecular weight and co-monomer content as function of the normalized concentration).
Data-set presentation
The initial data-set is 4837x3 matrix. With the 3 variables being the molecular weight, the co-monomer content and the normalized concentration.

These distributions contain a lot of information, so we need to clearly define the problem.
Problem definition and analysis strategy
The goal is to generate predictive models of the films mechanical properties that include both the characteristics dimensions and the molecular compositions.
The point know is to find a way to extract useful information from the data we have. One solution can be to use a 2D gaussian distribution of the initial data-set. In fact the 1D gaussian shows that our data-set can be devided into 2 populations.

Using the Gaussian will be an effective way to reduce the data set. So the next step will be to explore this direction. The final problem statement will be made in the next post. Stay tuned.
workflow update
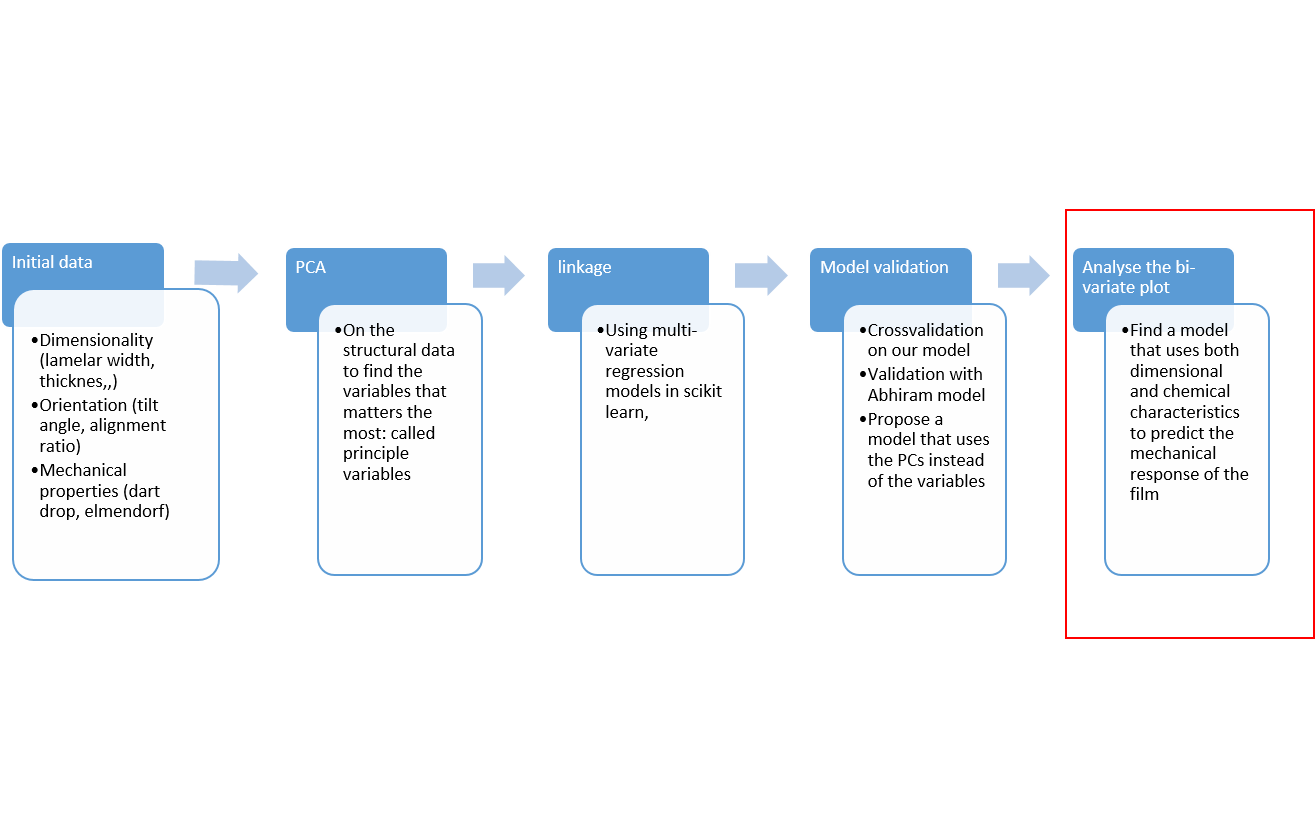
As for our workflow, we already proposed linear predictive models for the mechanical properties of the films based on the characteristics dimensions. The next step is to complete these models with the molecular composition.
