Phase Field Models of Ternary Eutectoid Alloys (Presentation 1)
Almambet Iskakov, Robert Pienta
12 00 AM ,Mon, Sep 14 2015
Background
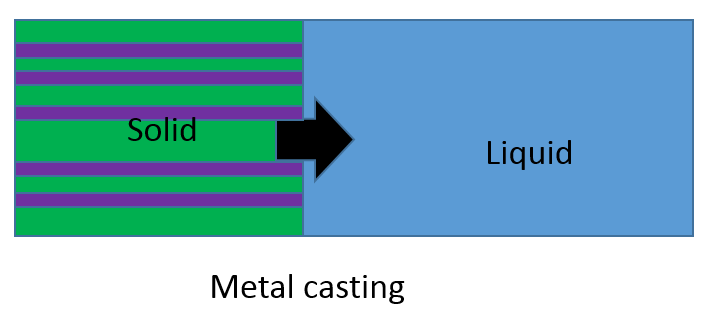
- Directional Solidification of Al, Ag, Cu Eutectic Alloy
- Control structure during solidification process
- Align phases/structures parallel to growth direction
- Achieve desired material properties
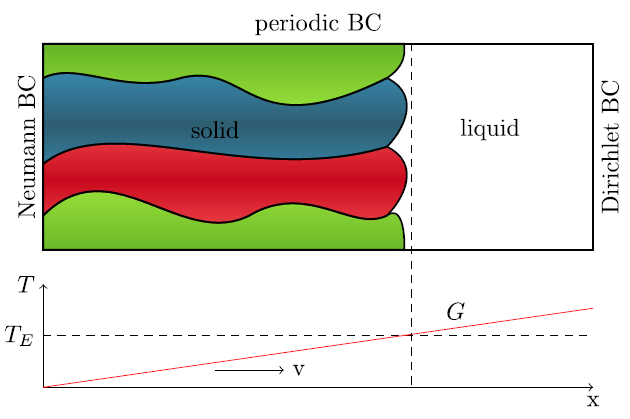
Phase-Field Simulation: Solidification
- Solidification Model:
- Simulate growth of phases
- Thermodynamic model
- Concentration model
- Three phase metal
- Varied Parameters: Temperature Gradient and Gradient Velocity
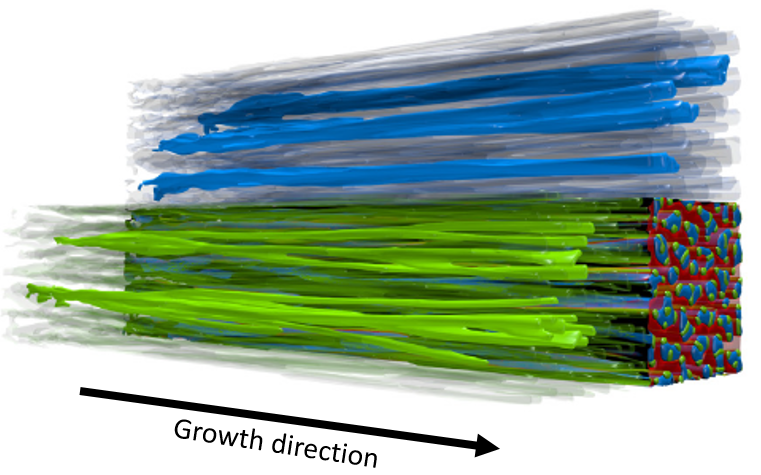
Directional Solidification Visual
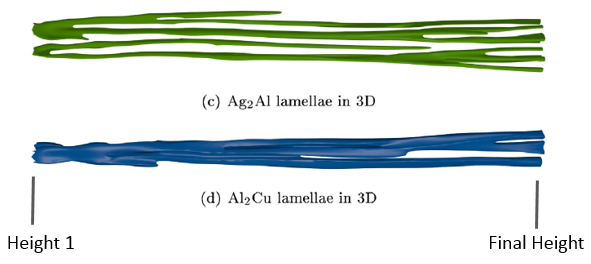
Phases evolve parallel to growth direction.
Binary Phase Diagram
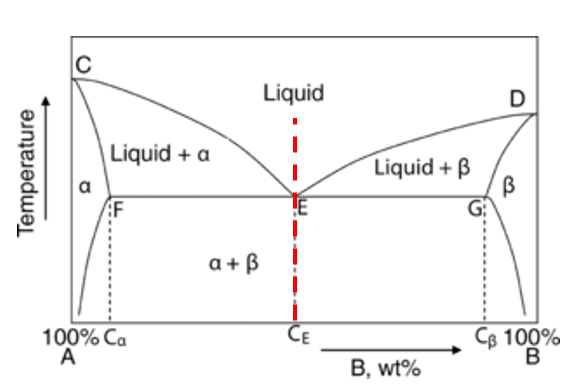
- Eutectic mixture:
- Liquid transforms into two different phases
- Lowest melting/freezing temperature
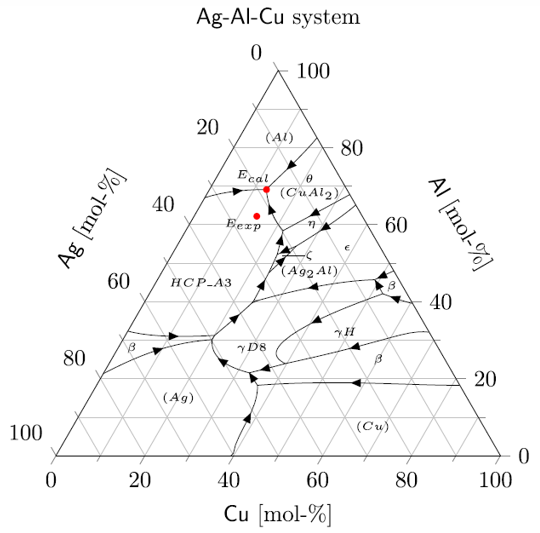
- In this Al, Ag, Cu alloy, the eutectic ratios by mole fraction at 773.6K:
- 18% Ag (25% experimental)
- 69% Al (62% experimental)
- 13% Cu (14% experimental)
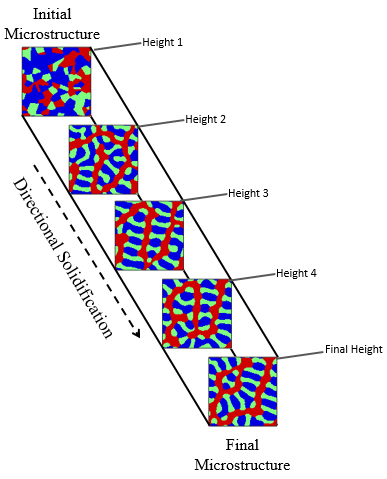
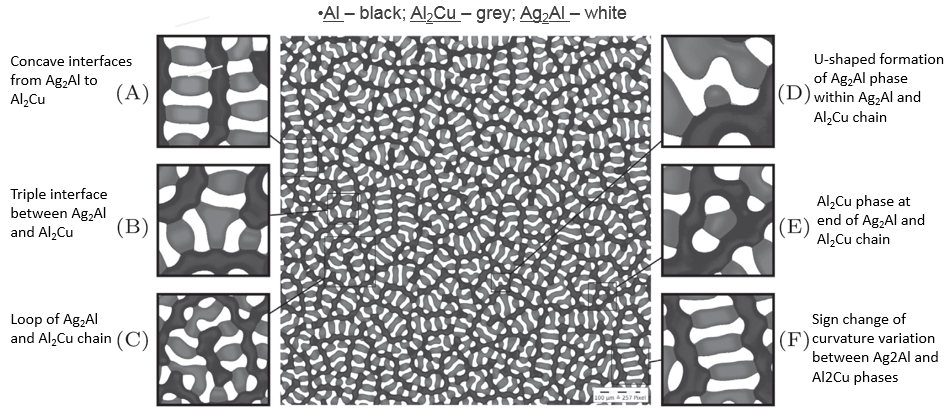
Simulated Microtstructure
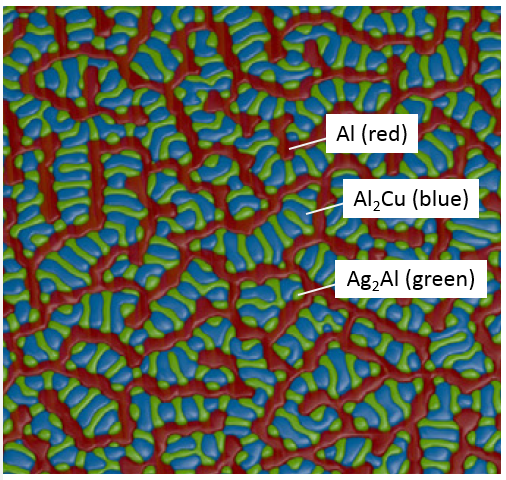
- A cross-section of solidified material close to solidification front
- Most continuous phase: Al
- Chained brick-like structure: Al2Cu and Ag2Al
Common Microstructure Patterns
The Data
- More than 20 simulations
- Resolution from 200x200 to over 2000x2000
- Simulated with varied solidification velocities
- Varied volume-fractions of Al, Ag2Al, and Al2Cu
- Plenty of measurements!
- An 800x800x4256 sample has 2.72 billion data points
- This simulation took 16 hours on 13700 cores!
- An 800x800x4256 sample has 2.72 billion data points
Simulation in action
Al = Green, Ag2Al = Orange, and Al2Cu = Blue
Extracting Features
We have already started generating spatial statistics (correlations) for our data
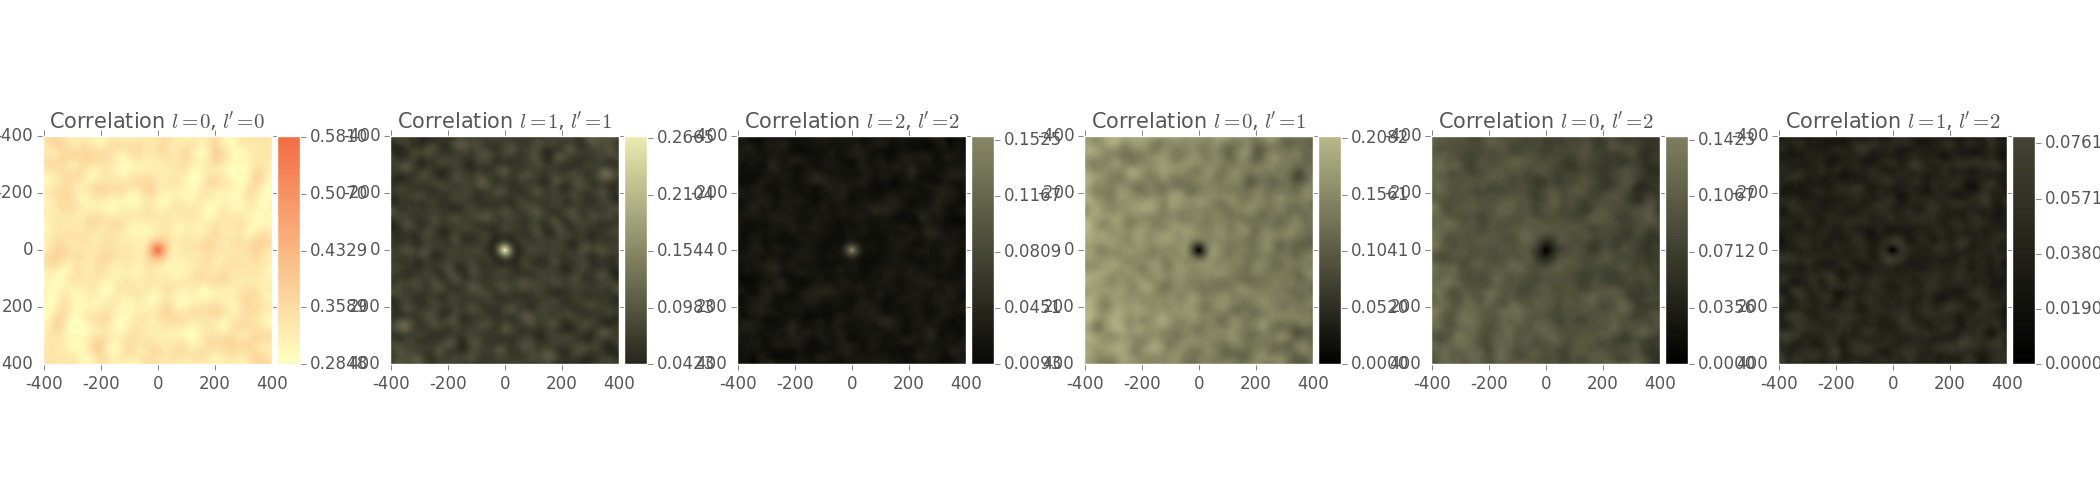
0 = Al, 1 = Ag2Al, and 3 = Al2Cu
Distance-varying Distributions
- The simulated microstructures vary through the course of each simulation
- We can sample the approximate steady-state, solidified structure at various times,
- using the difference between successive spatial statistics
- or just using one of the last time/height steps (assuming that the simulation was run until a steady state was reached)
- We may later consider the changes in spatial statistics over time to help mine the Process-Structure linkages
Computational Plans
Next Steps
- Use dimensionality reduction (DR) over our large space of spatial statistics:
- Conventional PCA
- Newer low-rank approximation DR techniques
- (possibly) Attempt to use locality sensitive hashing
- Model the relationship between our simulated solidification processes
- linear model (regression)
- interpretable
- simple model, unlikely that Eutectoid Al has linear structural relationships
- nonlinear model (kernel methods)
- less interpretable
- complex model, can model complex relationships
- linear model (regression)