Onto Transience
We have finished our study and prediction of steady-state behavior for our data and now are investigating the transient behavior.
Sampled Block Behavior
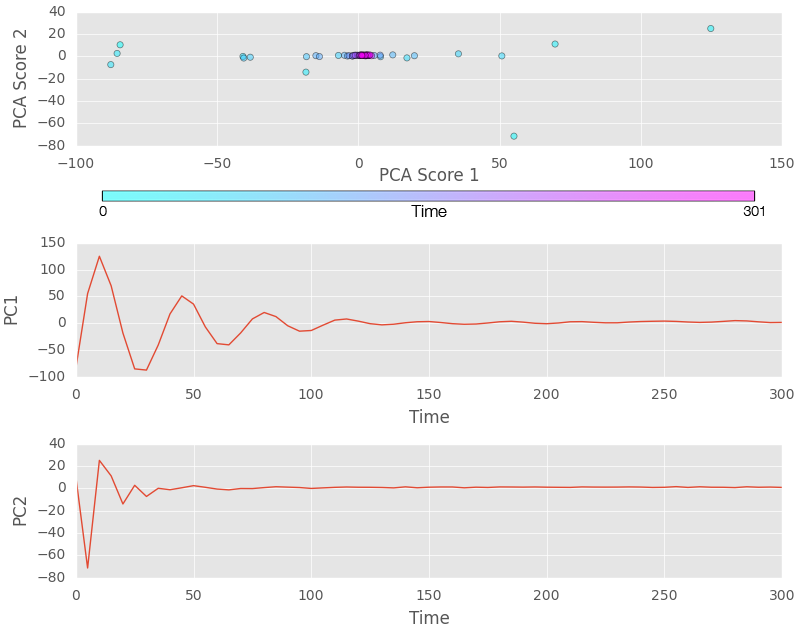
We sampled a single simulation at every 5 time steps to show the evolution of the block in PCA space. We plot the first two PCA scores from the 2-pt statistics across all correlations below.

Note how unstable conditions are in the first 100-150 timesteps. We can see this variance demonstrated through the first two PC values, which track the largest variance in the block. They oscillate wildly in the early phases, because the initial seed structure is just a voronoi generated with the right balance of elements. This is expected and suggests that we should consider only the first 127 time steps as being transient. We arrived at frame ~127 by looking at the oscillation in the first component across all 21 of our simulations. We used a threshold of % variation from the steady-state mean value.
Transient Period
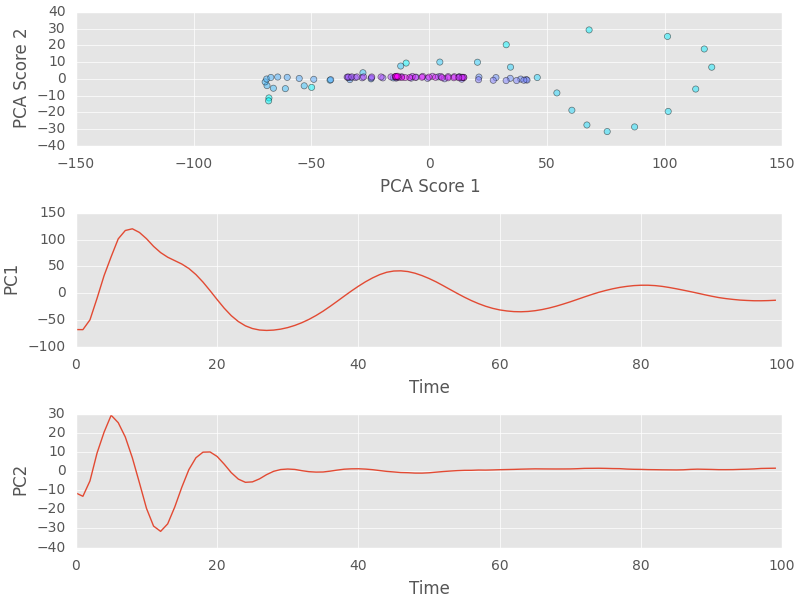
We show the first 100 time steps of our solidifying material in more detail below.

We can see an interesting pattern emerge, suggesting that consecutive timesteps do share some dependent data in 2-pt statistical space. This is necessary for us to model the time-varying behavior. The second component approaches steady-state much faster than the first, an interesting detail we have noticed across all our simulations. This may make the predictions of several PCA values much easier during our time-varying regression.
Correlation Selection (Sanity Check)
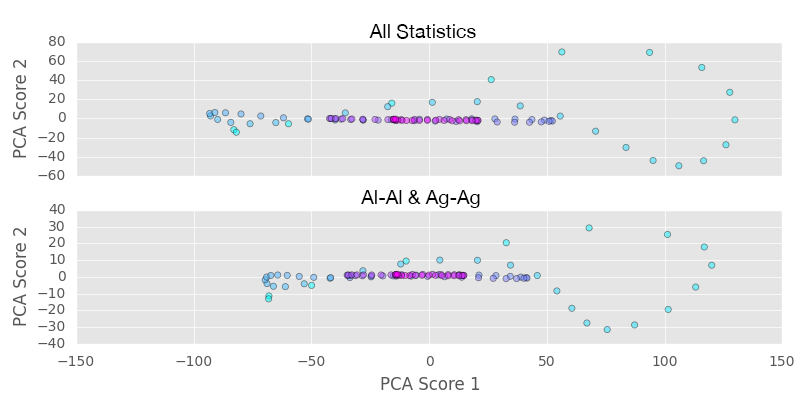
Look at the side-by-side plots for the full set of correlations versus the Al-Al & Ag-Ag combination we chose to use in the last post:
 The 2-correlation version has considerably lower variance in the second component, but still has remarkably similar behavior (during the transient period).
Next Steps
We are now looking at using AR and ARMA to model the behavior during this transient period. Our next posts will be about the second pipeline we are building to perform this analysis.