Review
Remember that the ultimate goal of this project is to predict the strain intensification caused by the anisotropic particle clusters under various multiaxial loading conditions. To facilitate this we need to ensure that we’re accurately capturing the particle clusters as accurately as possible.
Dream3D
Dream3D is a piece of software developed out of the efforts from Ohio State and Carnegie Mellon and additional contributors. Further information and code can be found here. We can input various statistics to inform the creation of Statistical Volume Elements (SVE) to simulate. Unfortunately the relatively basic statistics that we’ve utilized were unable to create a representative distribution of particles as clearly apparent by the following images.
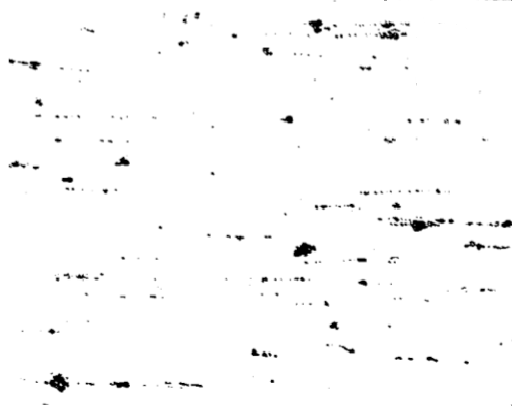
SEM of Al 7075-T6
 Reconstruction of particles using Dream3D
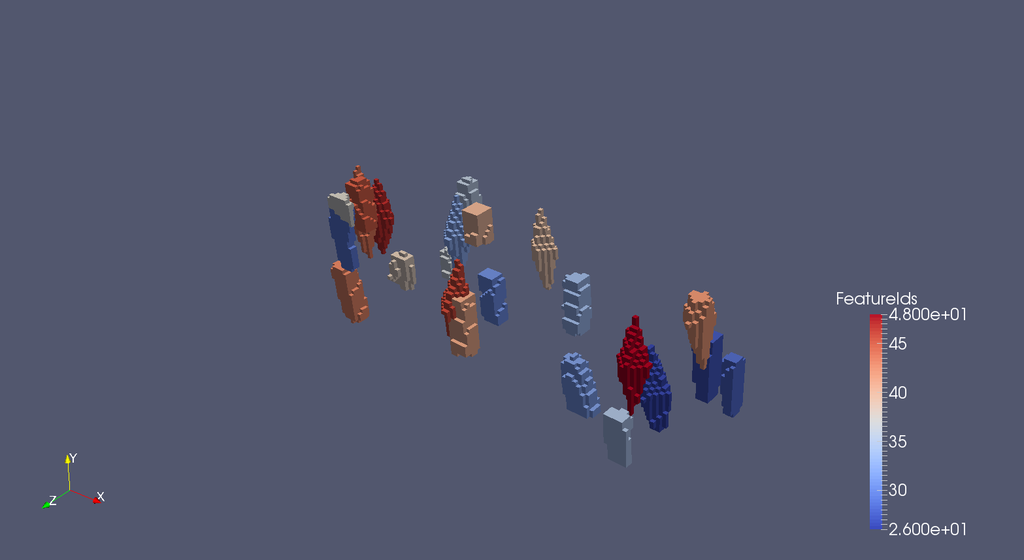
Note in particular the lack of variation in particle sizes for the Dream3D construction. The characteristic feature of the particles in this alloy is known as a “stringer” aligned in the rolling direction of the material as indicated in the above picture. In the referenced paper, pair correlation functions, a cousin of our 2-point statistics, were used as an optimization criteria to place a distribution of ellipsoids determined from scans of the material. Given the scope of this project, creating such a piece of code from scratch would be a monumental task. Fortunately, a discussion with Dr. Kalidindi yielded knowledge of a tool created by David Turner which uses 2-point statistics of multiple 2D images to construct a 3D volume.
David Turner 2-Point Reconstruction
Using scans from Dr. Rollet as inputs, the following reconstructed volume was made.
As you can see, the stringers are better captured using this method. The volume fraction was verified by simply counting the number of particle elements divided by the total number of elements (200x200x200).
A result of 1.8% falls well within the observed range by James Harris.
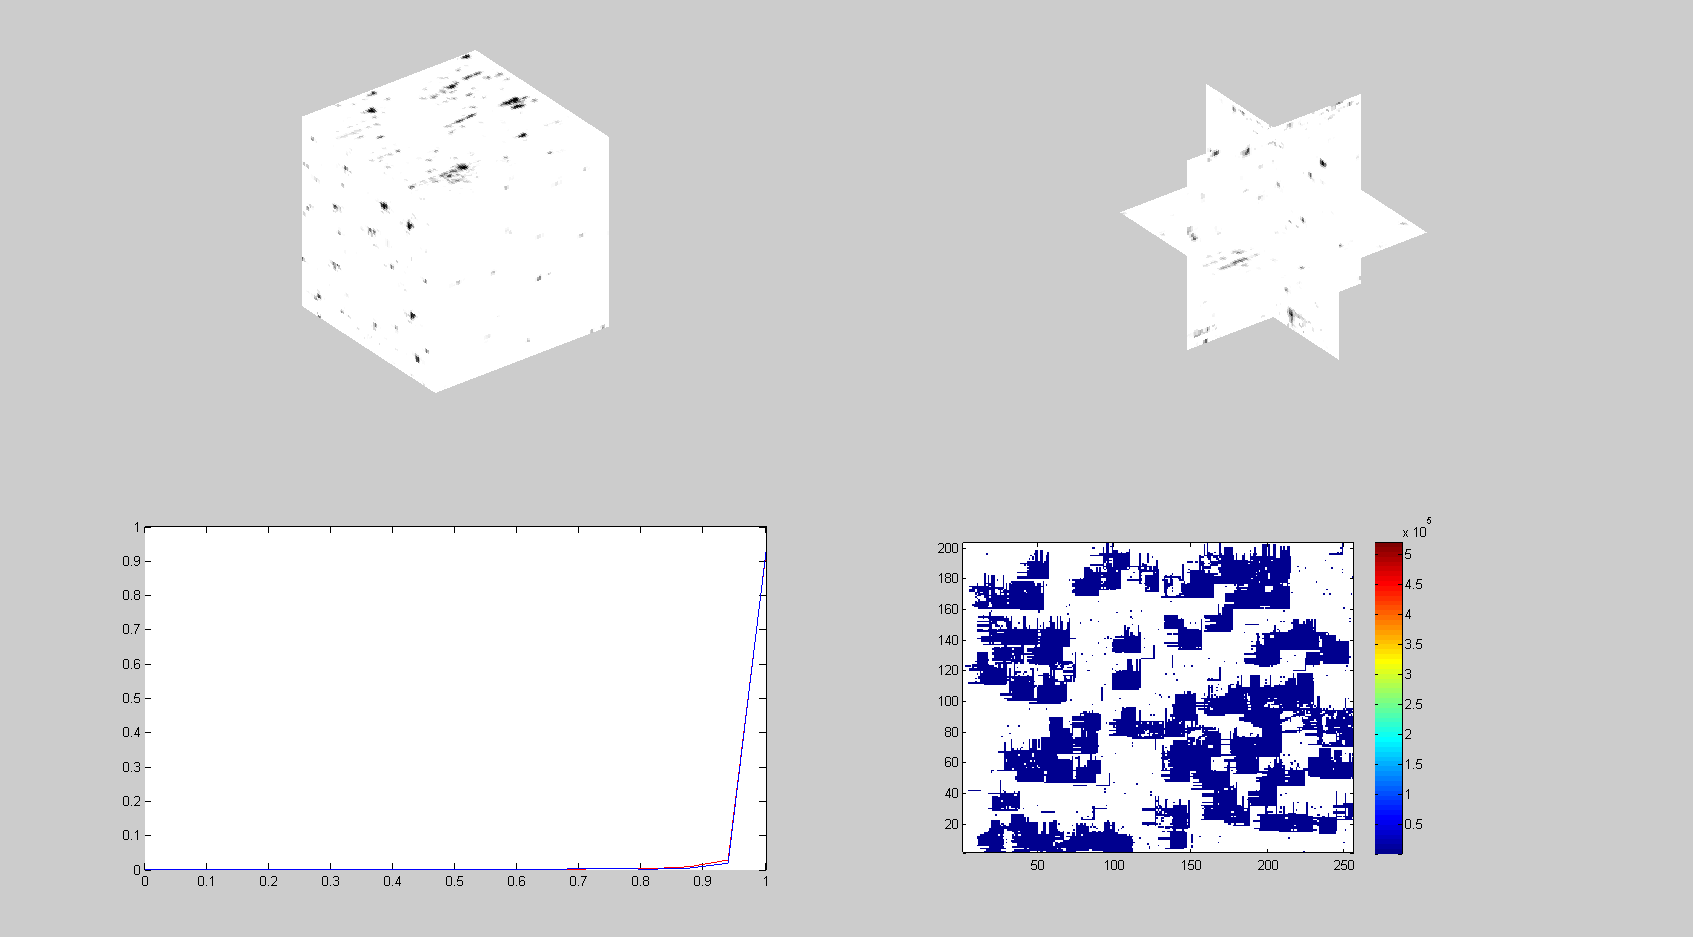
Also evident are the optimization criteria used by the software. These are based on the chord length histogram and the 2-point statistic error (in this case displaying a single slice). Further analysis based on the 2-point statistics will be presented in a later post to quantify how successfully the microstructure is reconstructed for our final intensification predictions using MKS.
Source
Rollett, Anthony D., Robert Campman, and David Saylor. “Three dimensional microstructures: statistical analysis of second phase particles in AA7075-T651.” Materials science forum. Vol. 519. 2006.
Harris, James J. “Particle cracking damage evolution in 7075 wrought aluminum alloy under monotonic and cyclic loading conditions.” Thesis. Georgia Institute of Technology. http://hdl.handle.net/1853/7534