Microstructures
After receiving microstructure images from the Rollett group, we were able to begin analysis on true data versus our previous simulated particles.
An example of these microstructure images can be seen below.
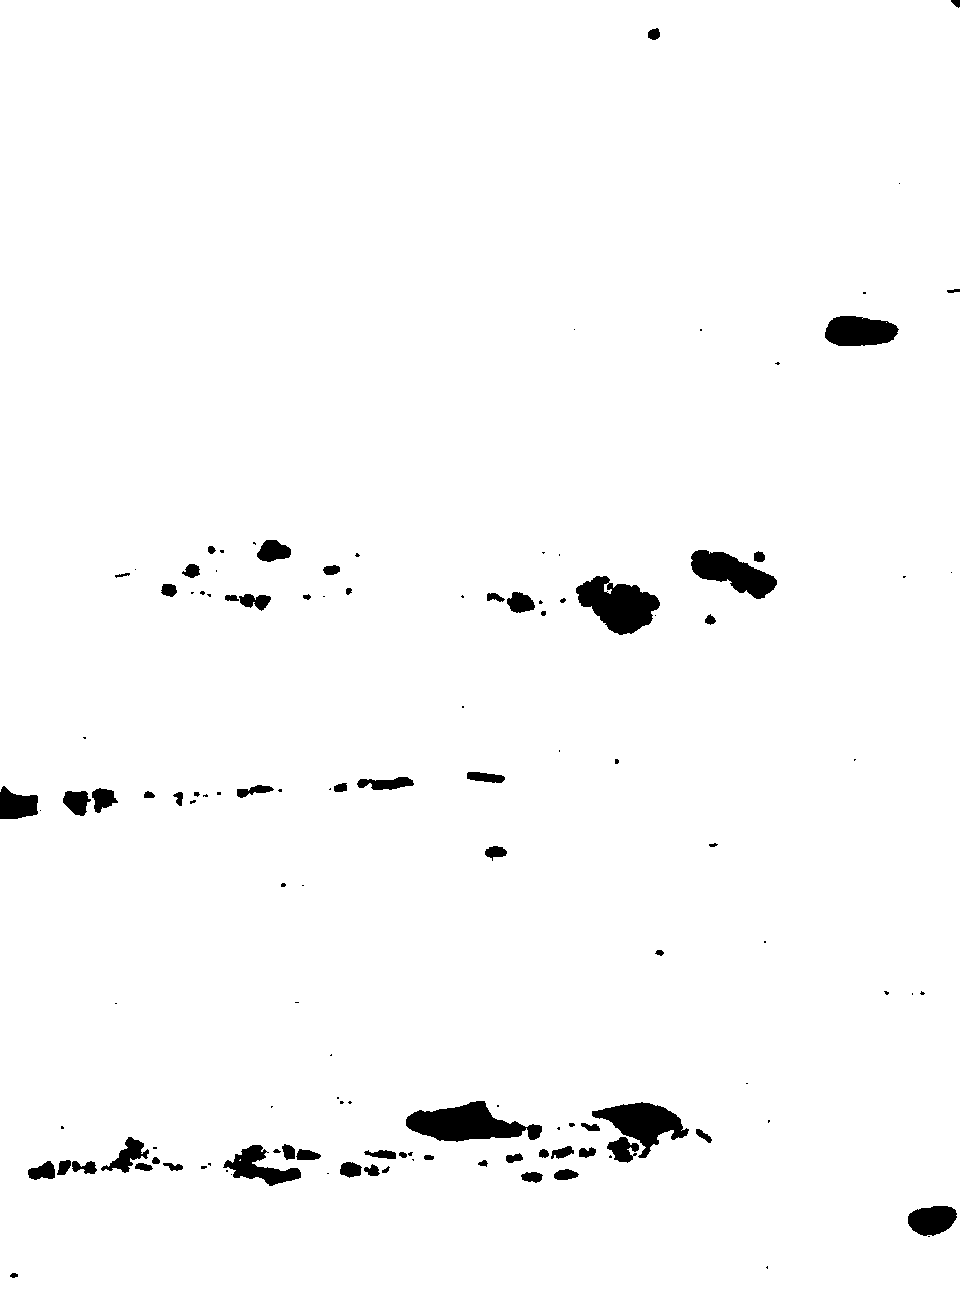
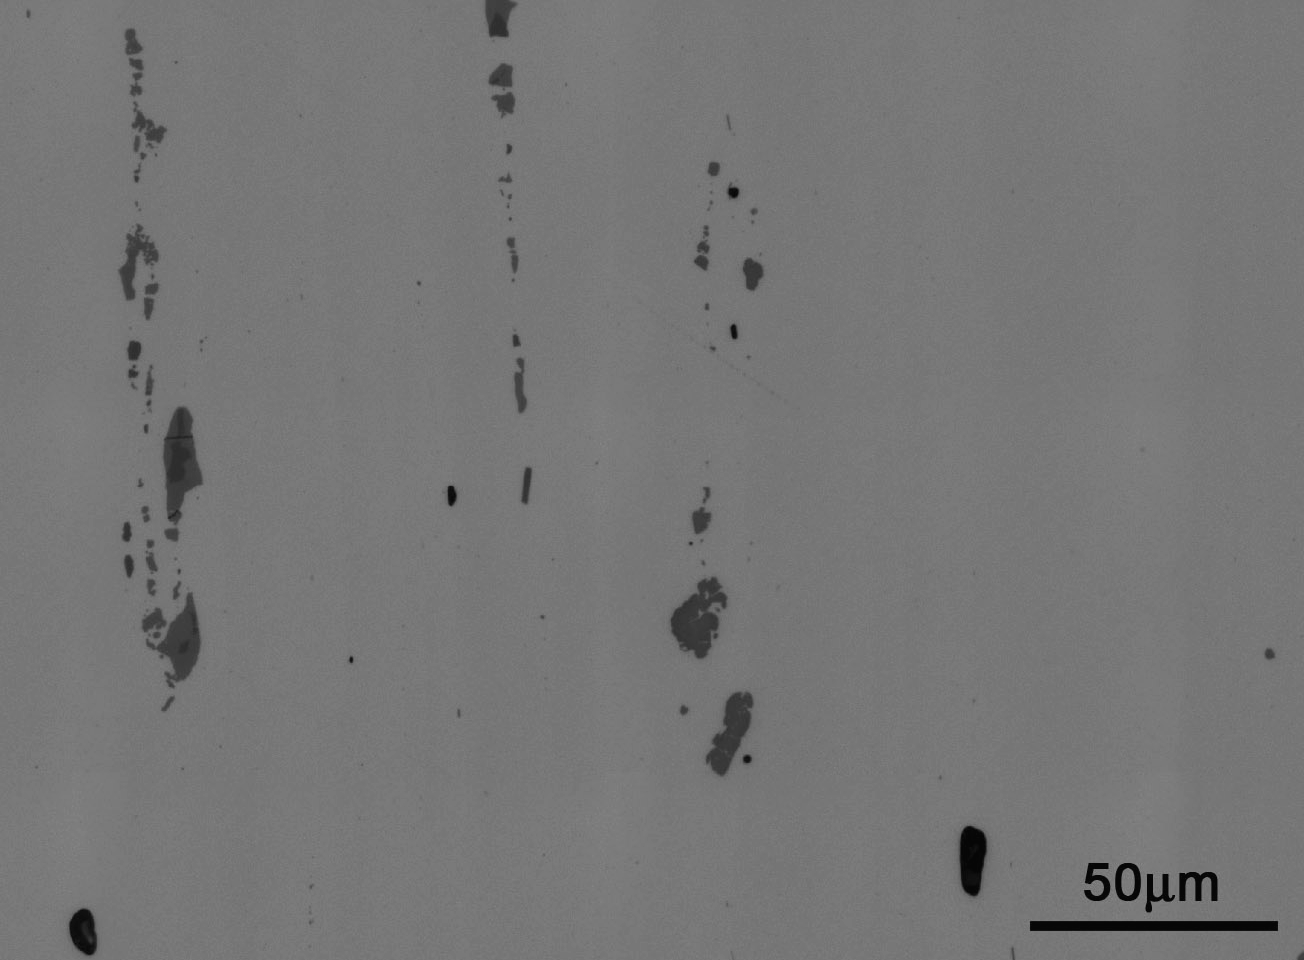 As can be seen, this image contains both a scale which would be problematic for our 2-Point correlations and is rather dark. After refinement and some image processing, the previous microstructure was cleaned to the following image.
 Comparisons
After cleaning all microstructure images, it was desired to compare the corresponding 2-Point statistics of all microstructures. A Python script was written to accomplish this task.
First, the microstructures were read in, and the large reconstruction microstructure was trimmed. Each microstructure was read in with a scale, detailing the number of pixels per micron. This information was generated using the image processing program GIMP.
A goodness of fit calculation was used to quantify the accuracy of the large reconstruction microstructure in each plane.
To quantify the difference between 2-Point statistics, two measures of error were calculated pixel by pixel. Mean Square Error was used for its popularity among error measures while Mean Absolute Error was considered as a check on MSE in the case that MSE was too heavily weighing outliers.
Comparisons
After cleaning all microstructure images, it was desired to compare the corresponding 2-Point statistics of all microstructures. A Python script was written to accomplish this task.
First, the microstructures were read in, and the large reconstruction microstructure was trimmed. Each microstructure was read in with a scale, detailing the number of pixels per micron. This information was generated using the image processing program GIMP.
A goodness of fit calculation was used to quantify the accuracy of the large reconstruction microstructure in each plane.
To quantify the difference between 2-Point statistics, two measures of error were calculated pixel by pixel. Mean Square Error was used for its popularity among error measures while Mean Absolute Error was considered as a check on MSE in the case that MSE was too heavily weighing outliers.