Boxplots of MSE and MAE
Recall for the previous post that we wanted to investigate the differences between 2-point statistics of the microstructure images. This was done for each unique set of microstructures. That is 1 compared to 2,3,4,5,6 and reconstruction, 2 compared to 3,4,5,6, and reconstruction, etc.
Now consider the MSE and MAE comparisons for microstructure 3 to all of its remaining unique comparisons. That is, the image does not contain comparisons to microstructures 1 and 2 as these were previously calculated.
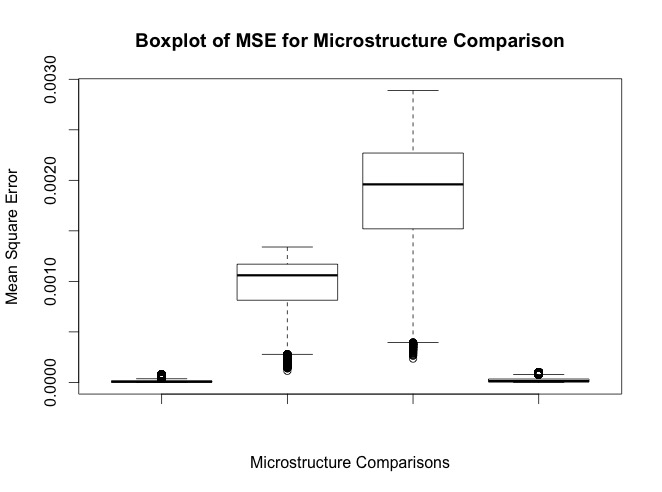 For the boxplot of MSE, it can be seen that error between microstructure 3 and microstructure 4 is so small, that the mean and IQR of the error is essentially zero. Furthermore, while the data is more spread in comparisons to microstructures 5 and 6, there are absolutely no outlying data points with a MSE error greater than 0.0030.
What this information tells us is that for MSE, the 2-point comparisons are extremely accurate on a pixel by pixel comparison scale.
Next, consider the boxplot for the MAE.
For the boxplot of MSE, it can be seen that error between microstructure 3 and microstructure 4 is so small, that the mean and IQR of the error is essentially zero. Furthermore, while the data is more spread in comparisons to microstructures 5 and 6, there are absolutely no outlying data points with a MSE error greater than 0.0030.
What this information tells us is that for MSE, the 2-point comparisons are extremely accurate on a pixel by pixel comparison scale.
Next, consider the boxplot for the MAE.
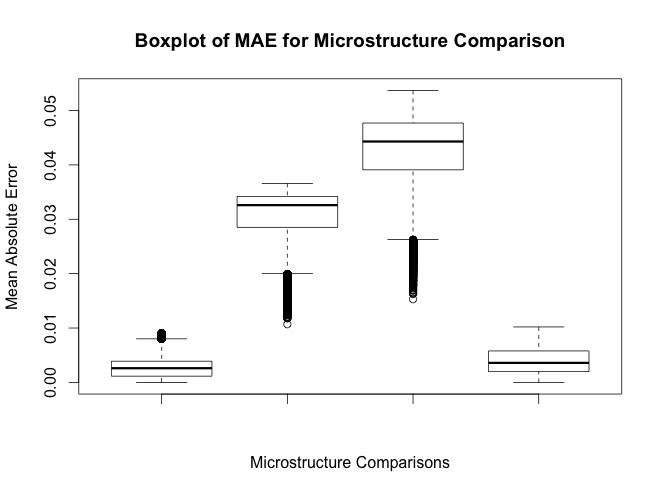 Again, we see that both the mean and IQR for the error between 3 and 4 is close to zero. One key difference in this case is the number of outliers in the comparison to microstructures 5 and 6. However we would be pleased as these outliers are all found below the IQR, indicating that they have smaller error, attesting to the accuracy of the comparisons.
Microstructures
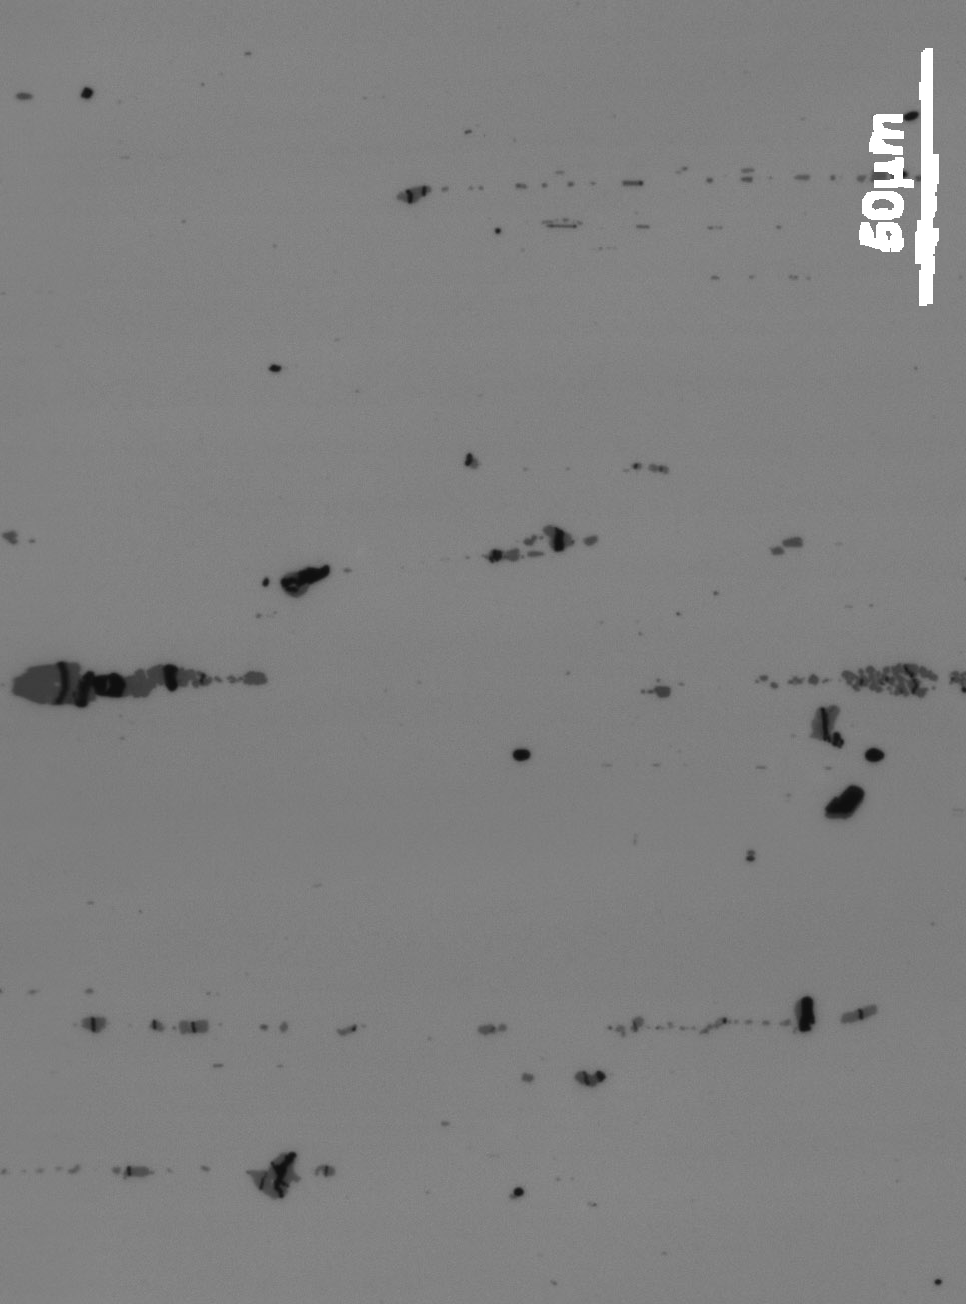
In this post there has been a large amount of focus put on the comparison between microstructures 3 and 4. Although this post has sought to quantify the similarity between the two, it is always desirable to view the qualitative similarities in the microstructures. As such, microstructures 3 and 4 are produced below for the reader.
Again, we see that both the mean and IQR for the error between 3 and 4 is close to zero. One key difference in this case is the number of outliers in the comparison to microstructures 5 and 6. However we would be pleased as these outliers are all found below the IQR, indicating that they have smaller error, attesting to the accuracy of the comparisons.
Microstructures
In this post there has been a large amount of focus put on the comparison between microstructures 3 and 4. Although this post has sought to quantify the similarity between the two, it is always desirable to view the qualitative similarities in the microstructures. As such, microstructures 3 and 4 are produced below for the reader.