The first step in quantifying the SPPARKS microstructure is to collect 2 point statistics in the three dimensional 300x300x200 grid using a 2-state micristructure function. The size, shape, and orientation of the grains is captured by segmenting the structure into grains and grain boundaries. Statistical description of the grain boundary data should be a rich description of the features we seek to quantify.
The procedure described here is applied to a single data point as a proof of concept. The structure presented here corresponds to a set of processing parameters: T=20, X, V=2.5, W=60, D=100, L=50, HAZ=5
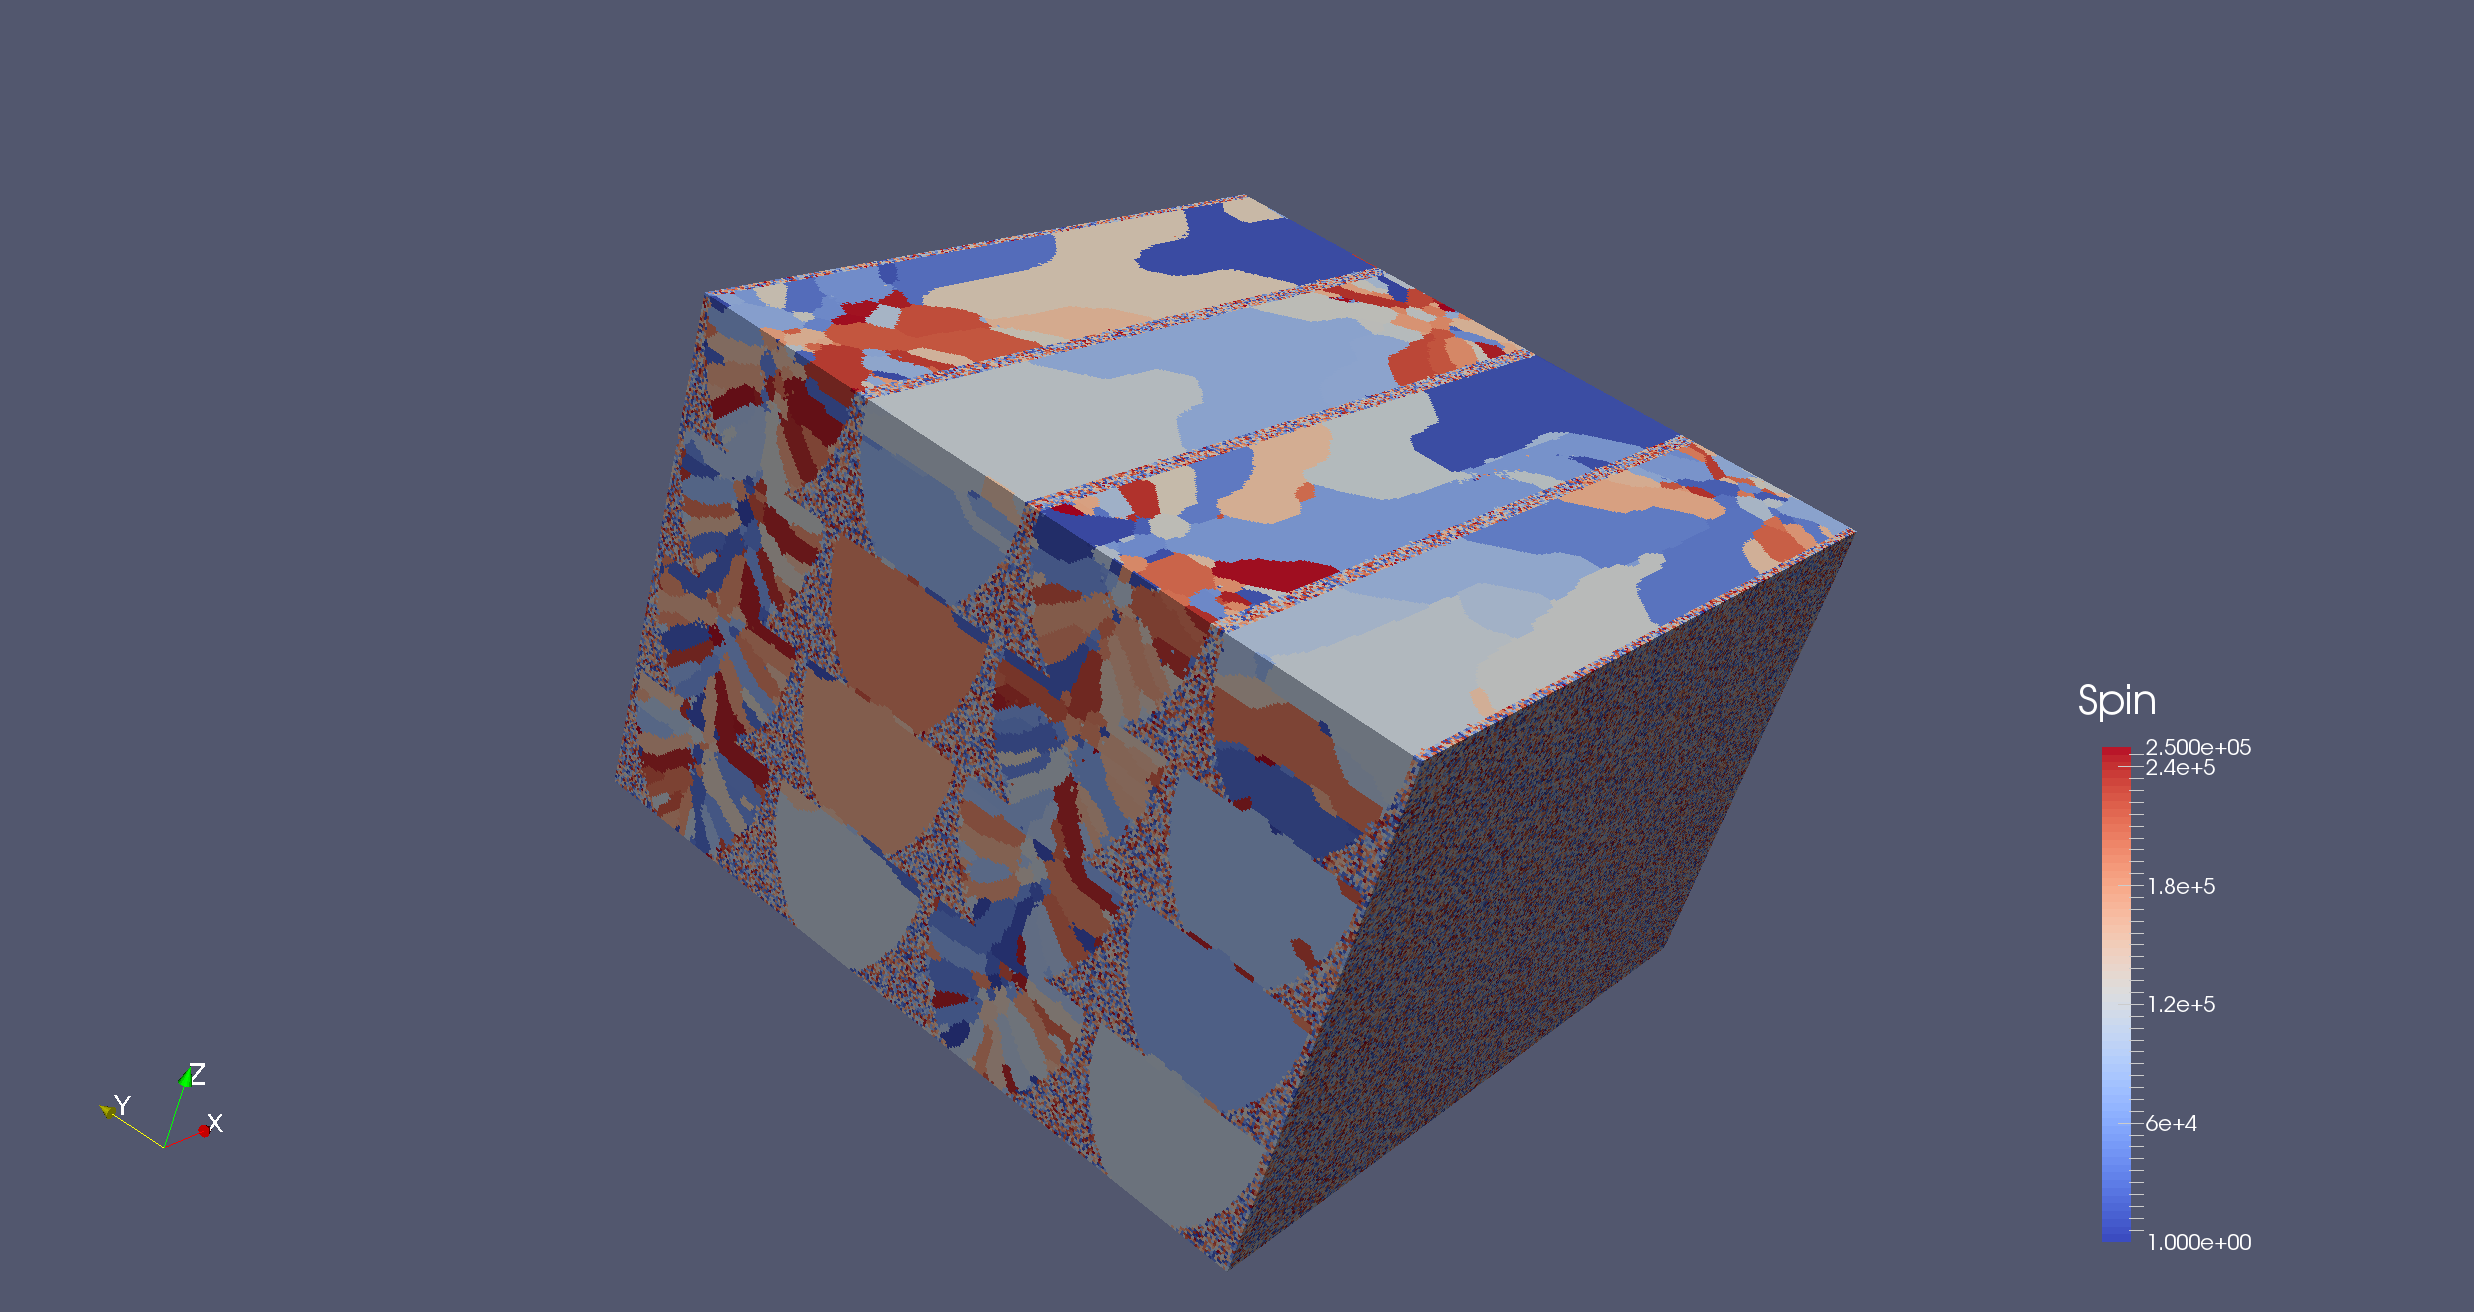 Fig.1. SPPARKS simulated microstructure for inputs: T=20, X, V=2.5, W=60, D=100, L=50, HAZ=5
The data as received consists of a single column of integers corresponding to grain IDs of specific voxels. A matlab script is used to reshape the file to a 300x300x200 array in preparation for spacial statistics. The z-slice #20 is displayed in Fig.2.
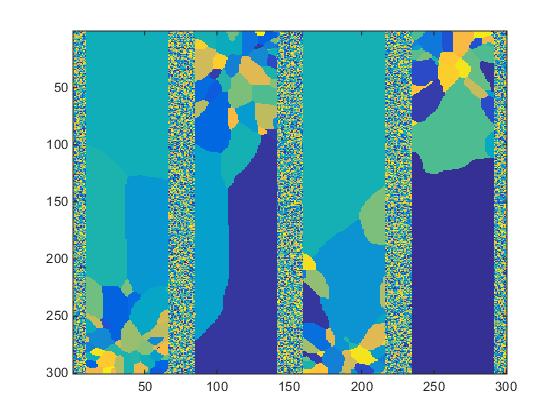 Fig.2. Slice #20 of structure shown in Fig.1.
The grain IDs range from 1 to 250,000 however regardless of the grain ID we select only 2 states: the grain and the grain boundary. The 300x300x200 ID array is processed with a grain boundary generation script to create a two color 3D structure. The processed slice #20 is displayed in Fig.3.
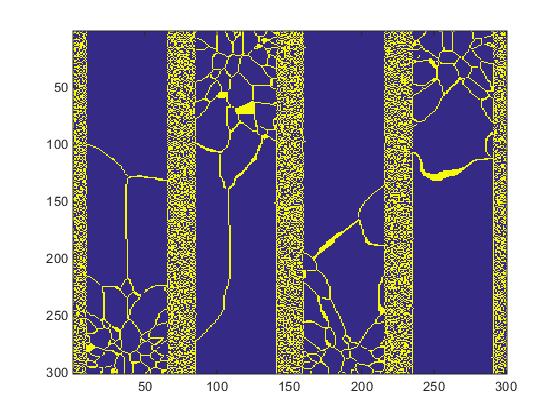 Fig.3. Two-state structure created by the grain boundary generation script.
The data is now fully ready for spacial 2-point statistics. A script utilizing CorrMaster libraries [1] is employed to create a 199x199x199 array of grain boundary auto-correlation information. The plot of silice #20 is displayed in Fig.4.
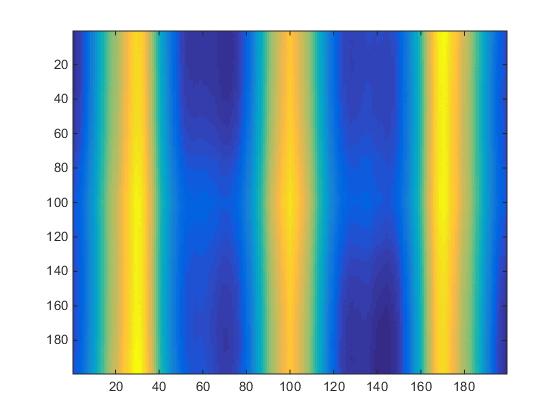 Fig.4. Two-state structure created by the grain boundary generation script.
The same procedure applied to slice #100 produces significantly different results as seen in Fig.5
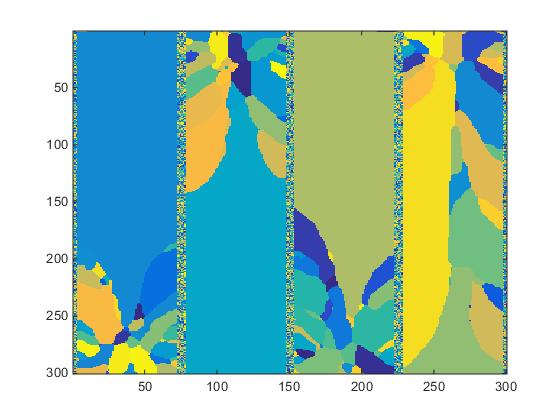
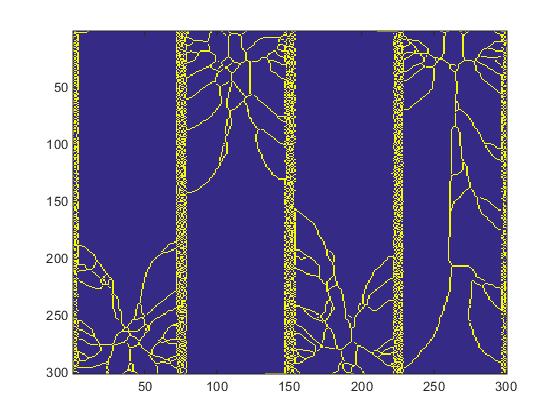
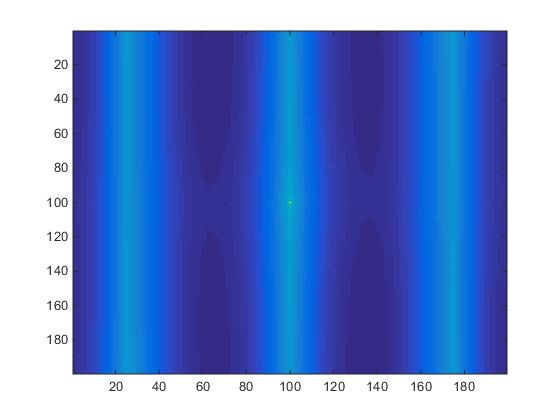 Fig.5. Slice #100 images.
This perliminary work shows that the presented procedure can be readily applied to various slices within a selected data point to quantify microstructure differences. Further work will generate spacial statistics for the entire dataset after which PCA used to seek process-parameter-structure trends.
References
[1] http://www.mathworks.com/matlabcentral/fileexchange/52601-image-correlation-and-convolution-for-large-data