The first step in the image processing actually happens after the scan are taken by the CT machine and they are outputted as TIFs. Preliminary thresholding is done by the software to eliminate material densities not in the range of interest. However, there are still several problems with the data that must first be fixed or worked around before the state matrix can be created:
Contrast
The first major issue is the low contrast of the images. The figure below is how the images appear when first outputted by CT software. The low contrast between the background, the membrane material, and the fixturing (tape and backing plastic) makes it difficult to separate out the membrane from the other regions that are not of interest.

For grayscale images, the intensities range from 0 (black) to 255 (white). To help with visualization, the image intensity was linearly scaled so that the lowest value is set to 0 and the highest to 255. The scaled image is shown below.
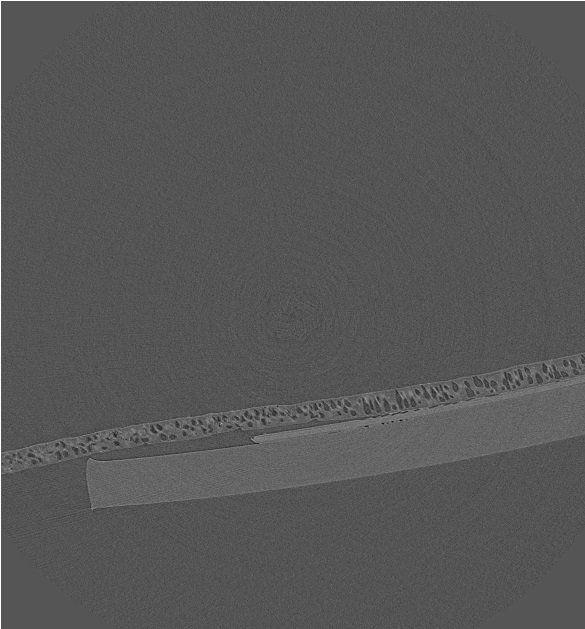
While the linear scaling does not help us numerically to segment the image, it does help highlight some of the other issues.
Background Noise
Even with the initial thresholding done by the CT software, background scatter/noise is apparent in the image when scaled. This is because the intensity values of this noise is within in the range found inside the membrane. Since it is not of uniform intensity, edge finding routines will find false edges other than the solid materials. Eliminating this noise will help simplify the other tasks involved in processing the image.
Empty Space
The region comprising the composite membrane is only a small fraction of the images. Even including the fixtures, the majority of the image is empty space comprising the background noise. This extraneous data results in longer image processing time and memory requirements and once the background has been identified, it will be cropped from the image.
Image Orientation
The orientation of the membrane in the different data sets varies. This must be corrected since the position of the particles from the top and bottom membrane surfaces is the main output of interest. This can be accomplished by simple rotations once the membrane has be identified in the images.
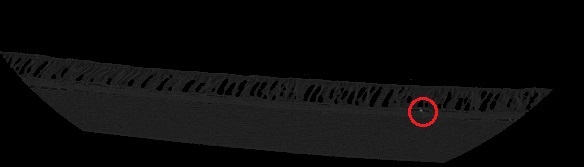
Fixtures and Contaminants
The issue to correct is to eliminate the fixtures and an contaminants that were on the membrane or tape. Small dust or other particles show up as high intensity regions which could be falsely identified as glass particles if they are near the surface of the membrane. The figure below shows and example of this where a contaminant is trapped between the membrane and tape. Since the density is of these contaminants appears to be significantly higher than the glass, this should not be too difficult and issue to fix. The most significant problem is identifying and eliminating the fixtures so that only the composite membrane remains.