In previous posts, many issues were discussed of our attempts to filter out the background “noise” and the apparatus used to hold the samples during the Micro-CT scans in our images. Unfortunately, while some progress was made, it was not progressing quickly enough for the purposes of achieving our goals for the course. Therefore, we decided to proceed by manually segmenting the images. This post describes that process. The images of the samples could be filtered to the point seen in Figure 1 and Figure 2.
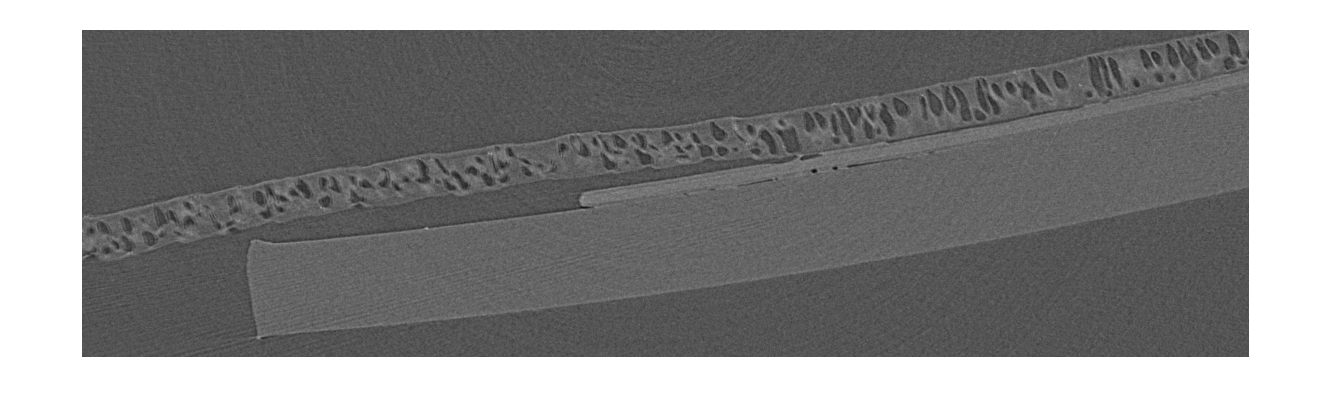 Figure 1 - Micro-CT scan of sample
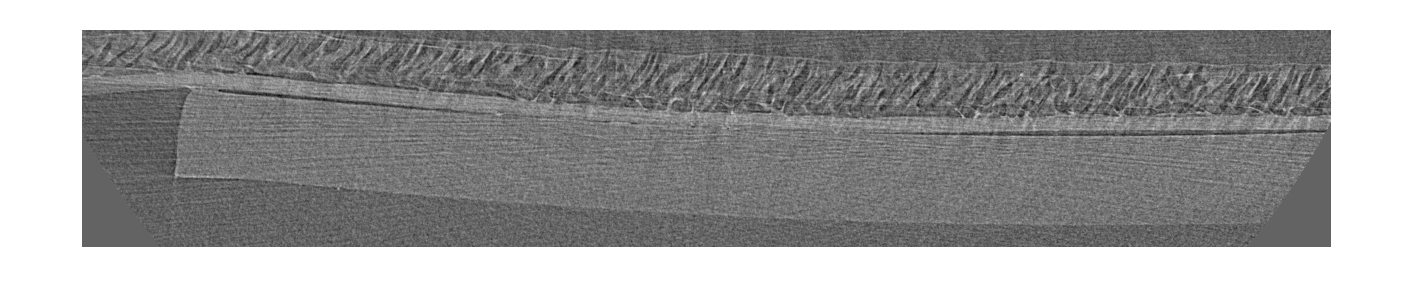 Figure 2 - Micro-CT scan of sample
 Figure 3 - Fake data created with MATlab
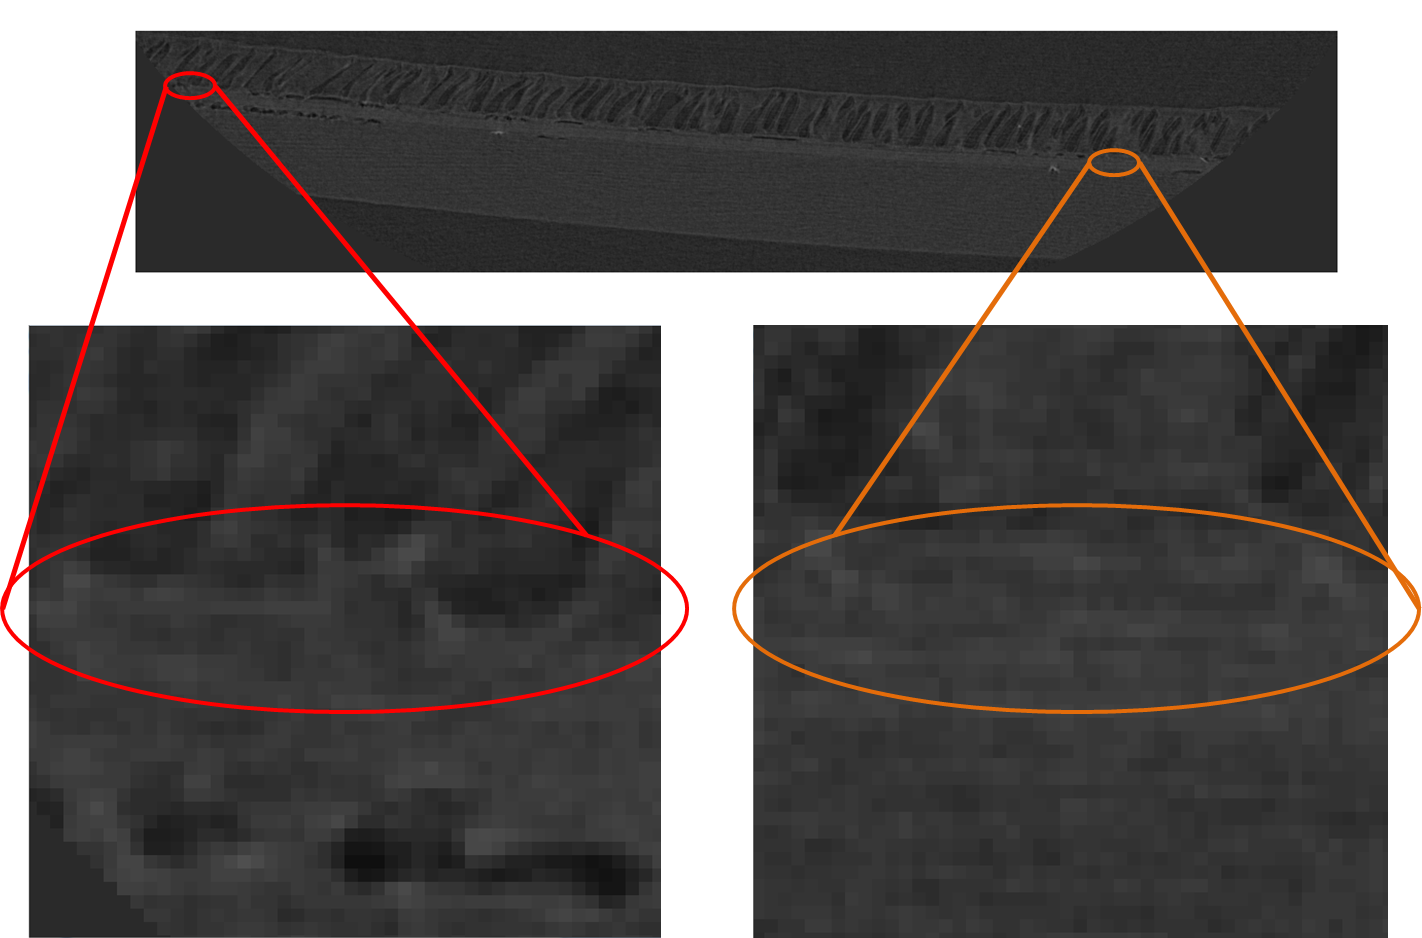
In a previous post, we discussed creating “fake” data using MATlab such as that seen in Figure 3 above. While, obtaining an image like the “fake” data from the Micro-CT scanner would be impossible, our main goal is to have the entire matrix consist of only the data found within the membrane. To achieve this, we need to be able to determine the upper and lower edges of the membrane. We have been trying to do this using an edge-finding program in MATlab, but we could not consistently produce good data using this program, so we conceded to marking the edge by hand. Each data files for each of the five samples consists 50 images that stack together to create a 3D representation of the membrane. It would have been completely unfeasible to manually locate the edges in all 250 images, so we instead marked the edges for 5 evenly-spaced images for each sample (25 images total) and interpolated between these images. To mark the images, we used an incredibly advanced program called Paint (sarcasm intended). Using Paint, we opened the TIFF files of the Micro-CT scans (such as Figures 1 and 2) and zoomed in to see where the edge was and colored it in pixel-by-pixel. Unfortunately, this process showed exactly why the edge-finding program was struggling. When we zoomed in to certain areas, it became very easy to lose where the edge was due to a lack of change density between the membrane and the support structure. This can be seen in Figure 4.
Despite the difficulty in determining which pixels made up the edges, we eventually were able to manually mark the top and bottom edges of all 25 images. Examples are shown in Figure 5 and Figure 6.
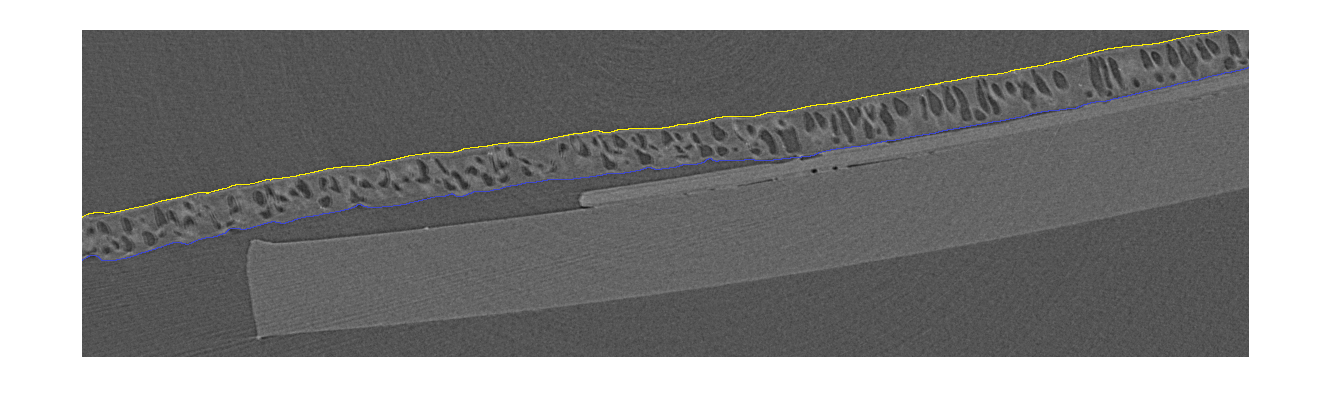 Figure 5 - Micro-CT scan of sample with marked edges
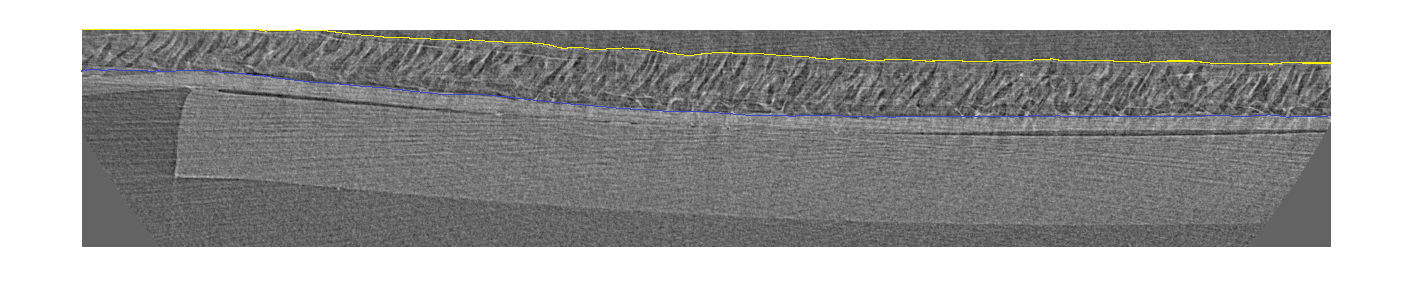 Figure 6 - Micro-CT scan of sample with marked edges
How we interpreted this manual data using a variant of the edge-finding program will be explained at length in another post. This is also NOT the recommended method for finding these edges. Another post will be made highlighting ways to avoid the issues we have encountered.