The purpose of this new blog post is to explain our followers what two measurements we want to use in order to establish a correlation between precipitates and grain growth.
At this point we have successfully ran 100 simulations each one of them with a different initial distribution of precipitates. Consequently we would like to extract some useful information from these simulations. Dr. Kalidindi has mentioned in class that the best way to “mine” data from large datasets is to implement the following:
-
Identify a Microstructure Function
-
Perform 2pt statistics
-
Do Principal Component Analysis (PCA) to reduce the dimensionality of your data.
Nevertheless he also mentioned to us that this is a guideline. Like a hamburger recipe, since everybody knows how to do a hamburger, it is the secret “sauce” that makes it unique and tasty.
In a previous post we explained our followers how we obtained the effective property we want to use for the establishment of the Structure-Property linkage and that the type of problem we were facing was a Homogenization one. Thus now we need to identify a correct microstructure quantification measurement that accurately captures the distribution of the precipitates.
After discussing with Dr. Kalidindi and from the class we have also learned that 2pt. statistics is an extremely useful statistical measurement that quantifies the microstructure distribution accurately. We decided to use the autocorrelation of precipitates with precipitates since this statistical measurement captures efficiently the distribution of the precipitates inside our Micro-structure. Also since the precipitates are fixed inside our microstructure this measurement should not change regardless at what time step is obtained, thus this quantity is a suitable precipitate distribution function.
Now with this measurement we now have all the necessary information to establish our structure-property linkages. The steps we intend to follow are detailed in the following figure, you can think of this steps as an expansion from the flowchart presented in the last Presentation.
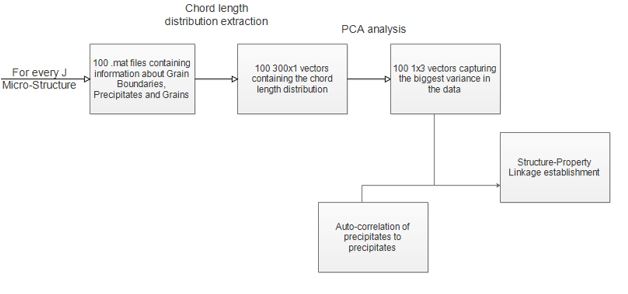
Please be on the lookout for the next posts since we will detail the PCA analysis performed as well as a preliminary analysis of results.