Initial notes
Our material system of interest is LLDPE which we are exploring the crystallinity. The amorphous and crystalline phases are differentiated by different scattering length densities for the respective phases.
Image Preparation
In order to perform reconstruction we need to first identify the two-point statistics of the autocorrelation in order to do phase recovery. This requires careful treatment of the data in order to successfully apply our relation from the autocorrelation to the two point statistics defined in the post here.
As a visual aid the basic process is shown below. In this plot we have $\rho(r)$ is the scattering length density distribution (SLDD) and $I(s)$ is the experimental scatter data we have. We are effectively back tracking to $\Gamma_\rho(r)$ which is the autocorrelation function of our SLDD. From here we can than find our 2-pt statistics.

Raw Image
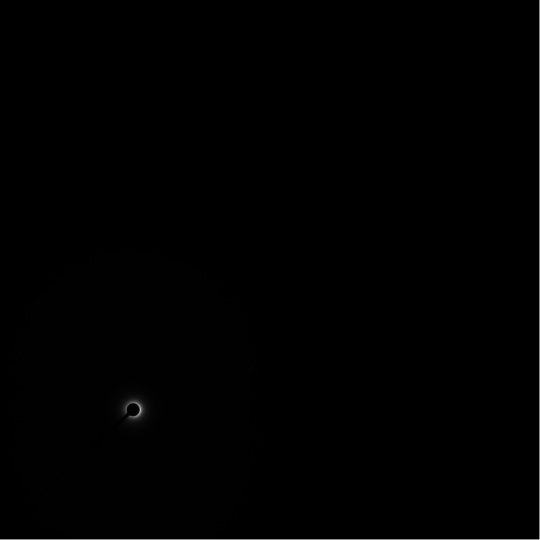
We first start with a raw image

Identify Beam Stop
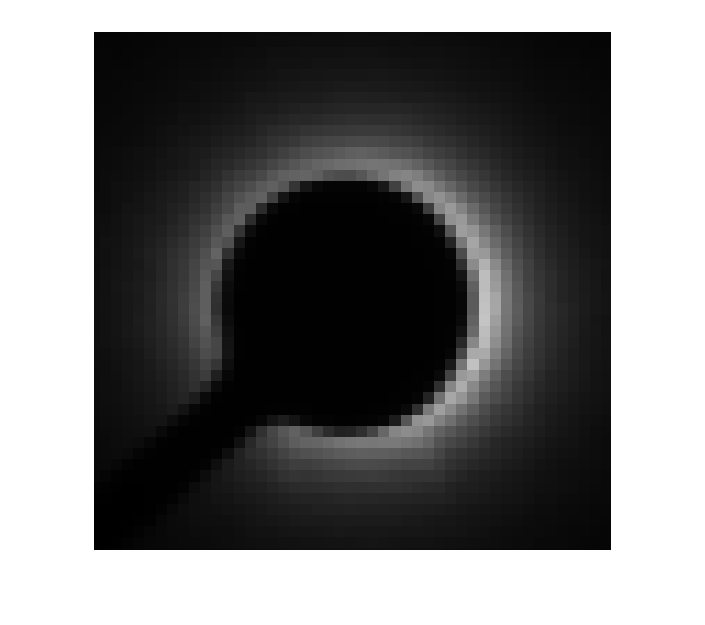
Now we identify the beam stop. We are in the process of determining the best course of action to account for the beam stop. For now we will apply the max intensity to the beam stop area. It is still necessary to identify the beam stop in order to apply symmeterize the image.
Original Beam Stop

Corrected with Max Intensity Method

Symmeterize image
Now after we have identified the beam stop we will apply symmetry to the image. Note: the image below does NOT have the corrected beam stop.

Autocorrelation
Now that we have working data we can proceed to the first step of finding the autocorrelation of the SLDD. The result is shown below.

This is the first step to getting 2-pt statistics. In order to complete the conversion we relate the mean squared fluctuation of scatter length density $/eta_0^2$ and the volume fraction, $V_1$, found experimentally to $Q$, which represents the total scattering power of the specimen. This is described in detail in the post here.
Sources
[1] R. J. Roe, Methods of X-Ray and Neutron Scattering in Polymer Science, 174-176, Oxford University Press 2000.