What is this post?
This will deal with visualizing the time evolution of the microstructure.
A giant mass of PCA
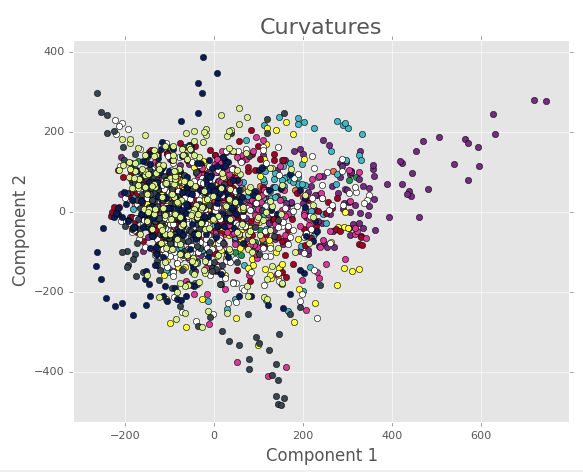
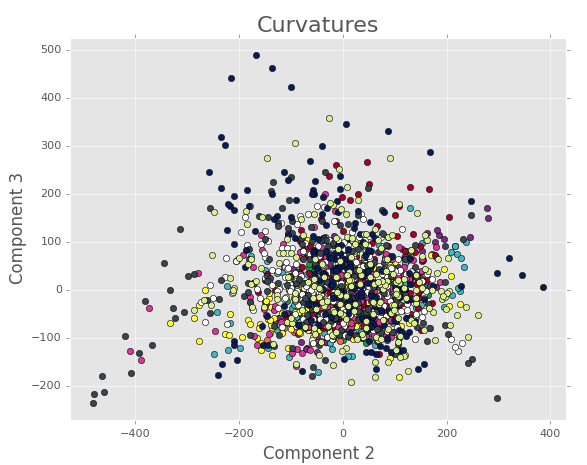
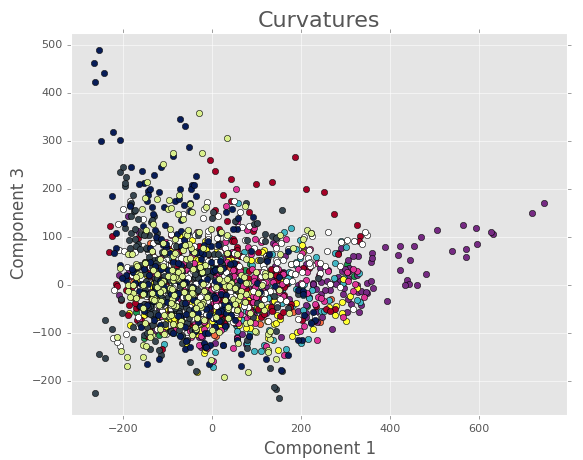
First we will look at the PCA for all the images we have where the images have been binned by the Gaussian curvature of the substrate. For 7 terms in the Fourier series and 3 terms in the Legendre polynomials, we have:
Components 1 and 2.
Components 2 and 3.
Components 1 and 3.
Note how it’s hard to pick out any trends or clustering. To try and see if the mess is because a bunch of coherent tracks are interfering with each other, we can take a closer look at some of the tracks in the individual bins.
Some tracks
We will show tracks from bin 2 (large negative Gaussian curvature), bin 7 (0 to slighly positive Gaussian curvature), and bin 10 (positive Gaussian curvature). The points are connected to show the time evolution. First, we look at tracks for 5 terms in the Fourier series and 3 terms in the Legendre Polynomials.
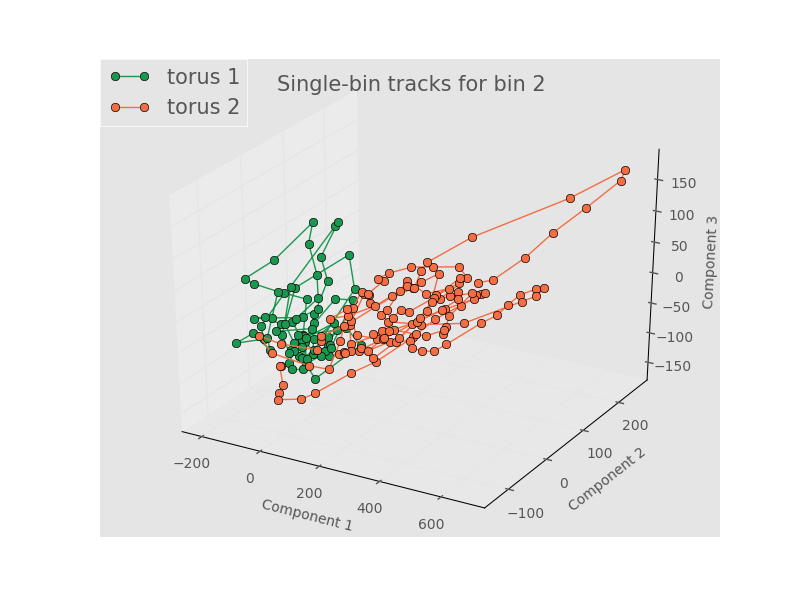
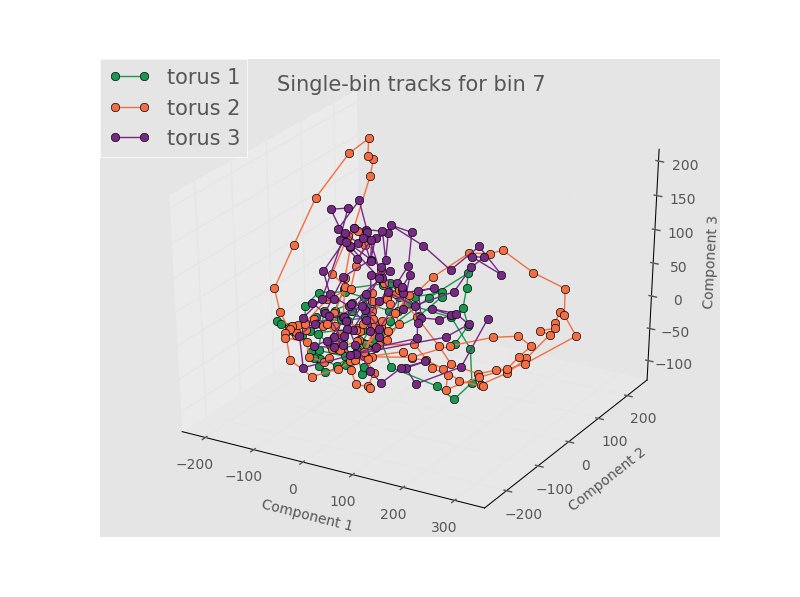
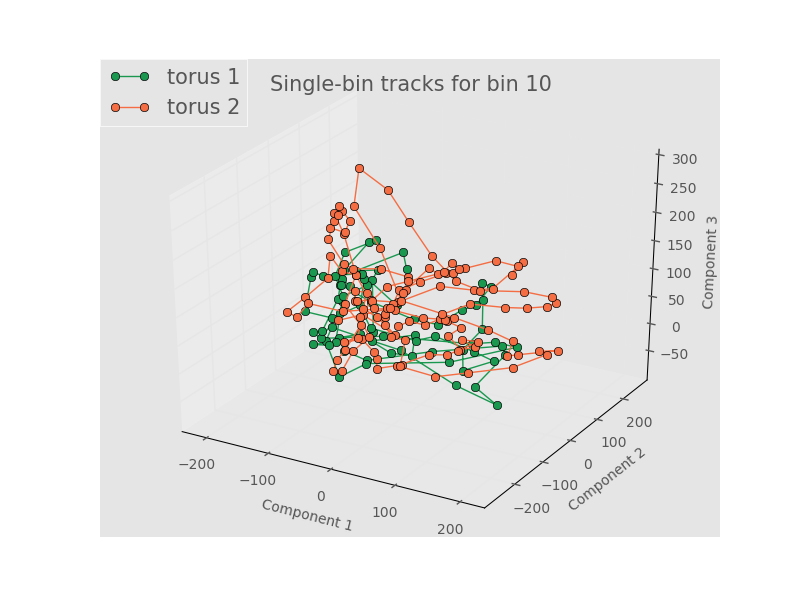
While there is a definite time evolution, the trajectories in PCA space seem to wind and cluster around the same point. In addition, the tracks from different toroids overlap and intertwine. As we were noticing more clustering/structure in PCA with more Fourier terms, let’s look at tracks for 9 terms in the Fourier series and 3 terms in the Legendre Polynomials.
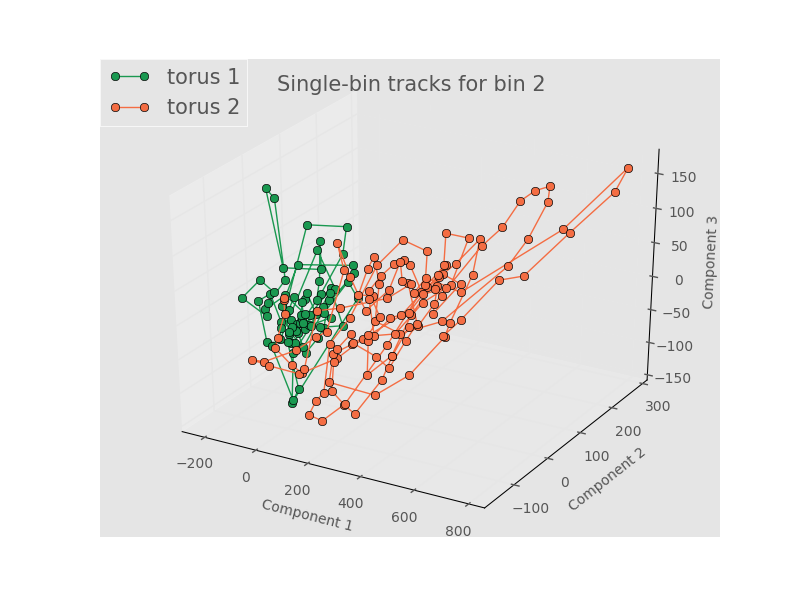
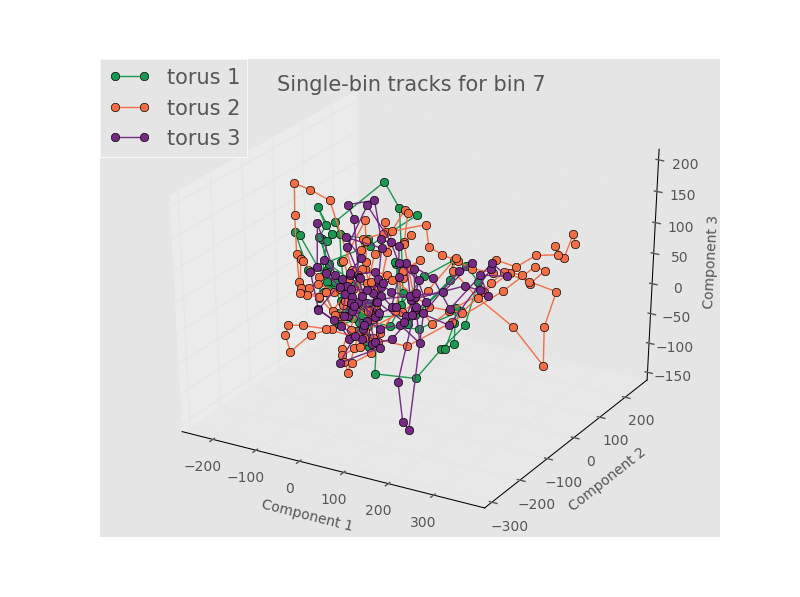
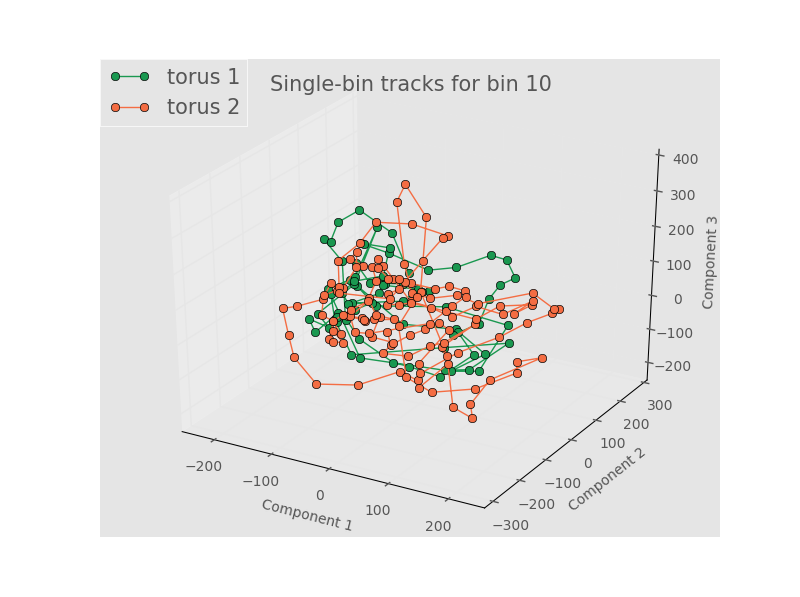
As with 5 components, the tracks between different toroids aren’t really distinguishable and wrap on the same area of PCA space multiple times. This seems to imply that the structure is evolving in PCA space around the same state (or set of states) such that any differentiation is washed out. It could also be a reflection that PCA is inherenly unsuited to a nonlinear process like this one. Finally, it could simply be that our bins aren’t physically big enough to have meaningful statistics. Recall that the size of the data for each bin passed to PCA has to be the same size, which means that we are limited by our smallest bin - the other bins get truncated to match the size of the smallest bin. As a test of this, let’s just do stats and PCA on each whole individual torus.
Stats for a whole torus
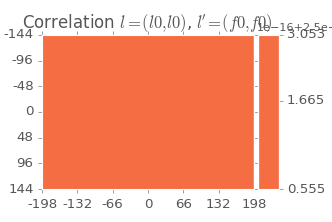
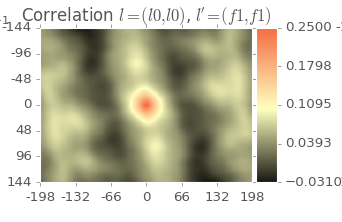
Here are some sample 2-point statistics for the whole torus. For the autocorrelation of the 0th Legendre term and the autocorrelation of the 0th Fourier term, we have a constant intensity image, as expected:
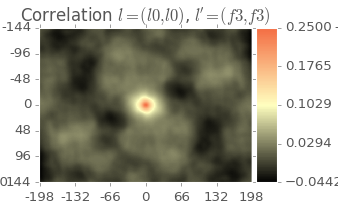
For the autocorrelation of the 0th Legendre term and the autocorrelation of the 1st positive Fourier term, we have:
Here we start to see a little more variation, with some clear banding at approximately 10 degrres measured CCW from the vertical. Now looking at the autocorrelation of the 0th Legendre term and the autocorrelation of the 2st positive Fourier term:
In comparison to the previous image, here we see that the intensity around the center of the image decreases faster and the period of the bands seems larger. In addition, the bands seem less structured. These stats are all for a single torus at a single moment of time. When we include all the images for all three toroids, we can now look at the output in PCA space.
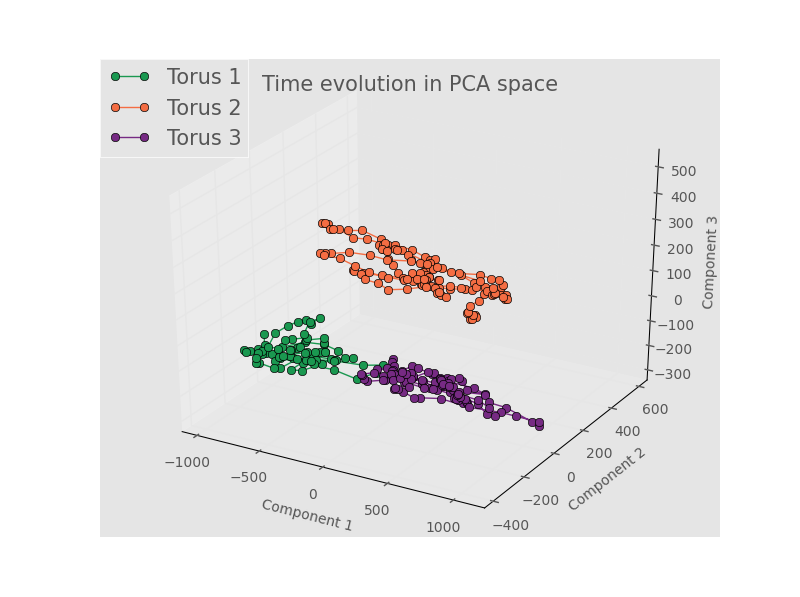
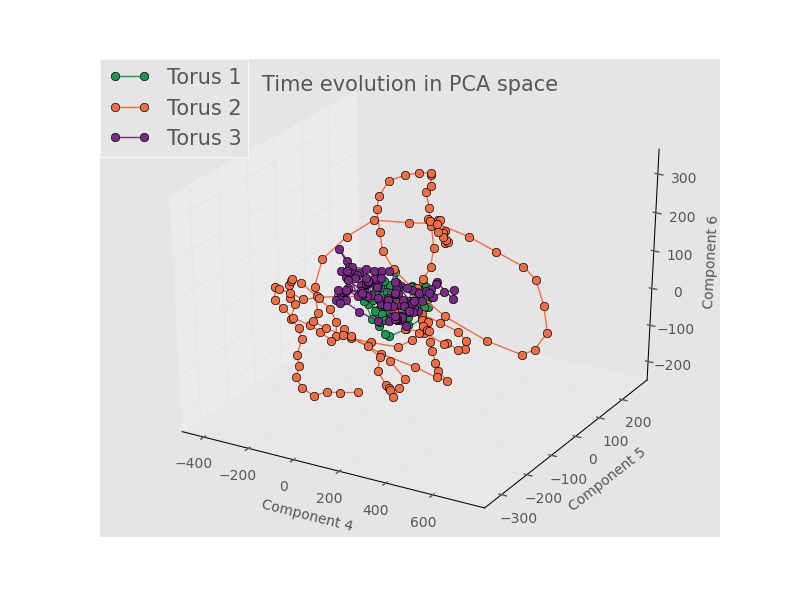
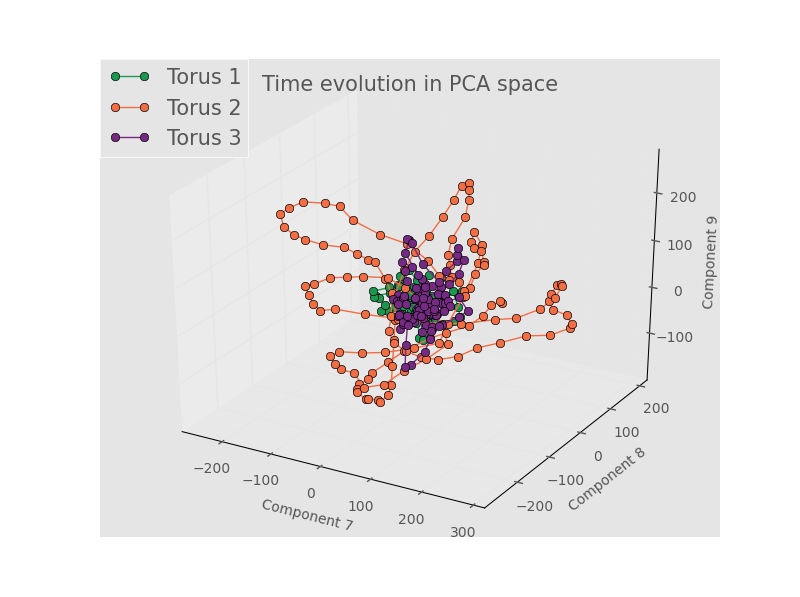
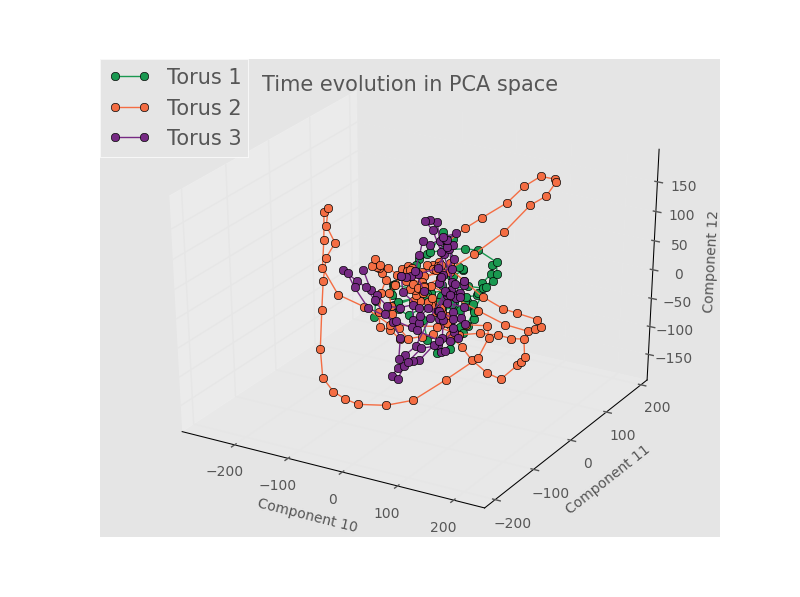
# PCA for a whole torus Below are 3 component plots for the full time evolution of three toroids in PCA space for 5 terms in the Fourier series and 3 terms in the Legendre Polynomials. I ran the data for 15 components:
Components 1 - 3:
Components 4 - 6:
Components 7 - 9:
Components 10 - 12:
Components 13 - 15:
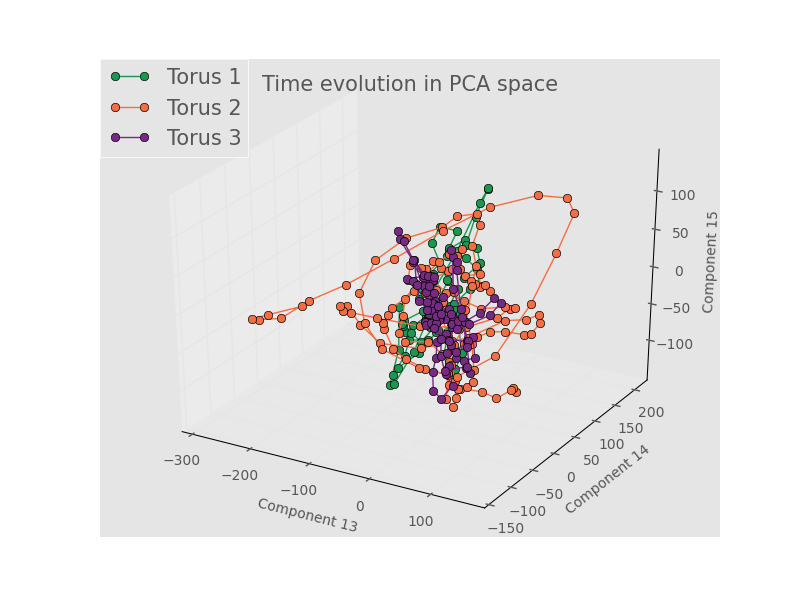
Note how the plot for components 1 - 3 show good separation, but for higher components the tracks for all three toroids wind around and through the same local area in PCA space. Torus 2 seems to span a larger range of the space, but that seems to be the only real difference my eye can pick out for the higher components. While the semester is rapidly coming to a close, this project will not end - the next thing to do will be to see if the trajectory through PCA space for a full torus can be prediced with some type of auroregressive model. Alternate dimensionality reduction and binning strategies will also be explored.
