As we spoke about towards the beginning of the course, our plan for 2-point statistics was to divide the membranes into bins along layers of the membrane. This allows us to add in another variable (y) to our PCA and better understand how the membrane changes in the y-direction.
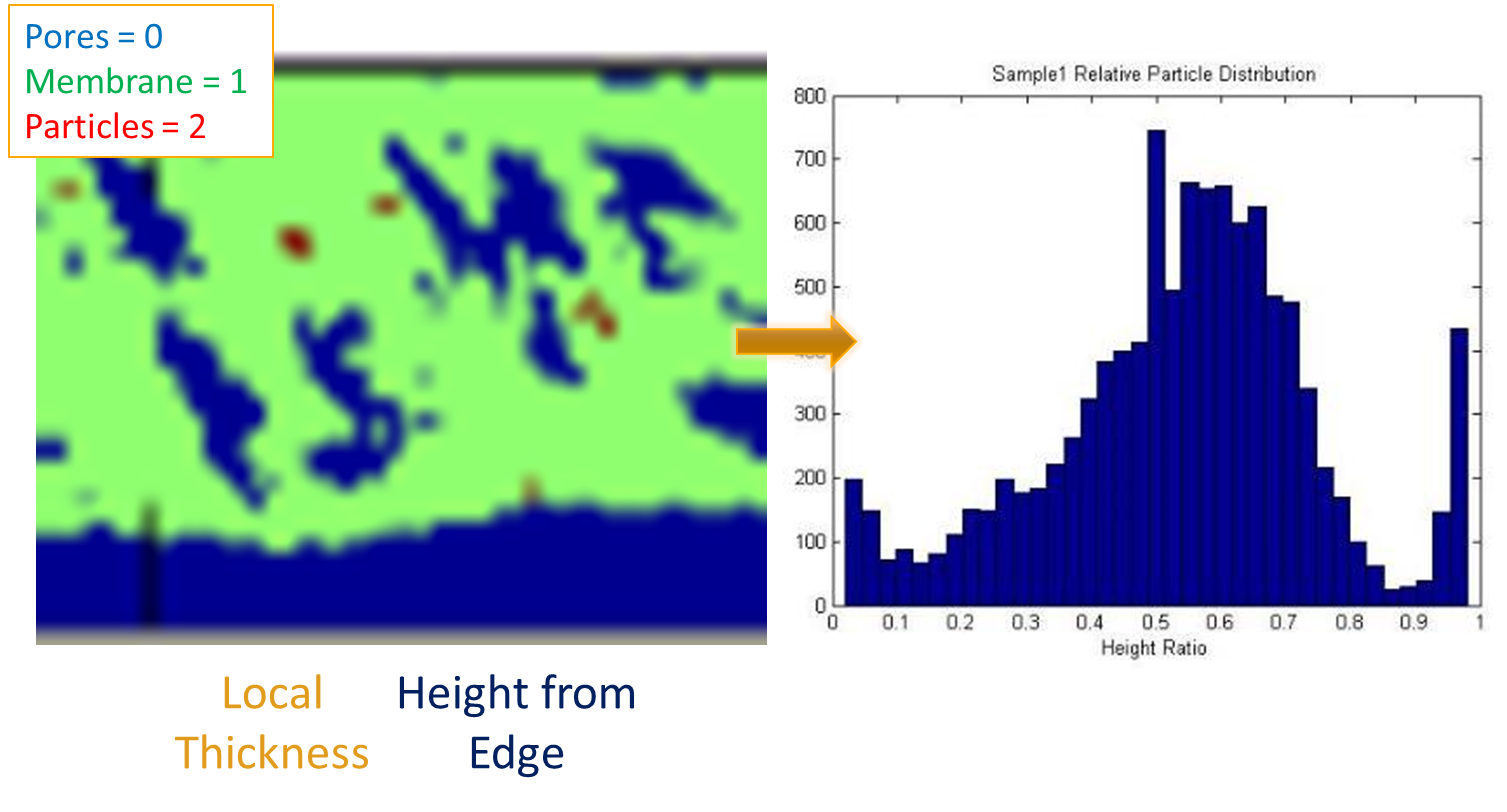 Figure 1
Now that we have data (some real, most simulated) we can finally run a meaningful 2-pt statistics and PCA.
Two-Point Statistics
The auto-correlation for Particles (state 2) returned an unexpected result, a Volume Fraction different than the 0.005 we plugged into the simulated data. We suspect this may be a result of either the way the simulated data places the particles in respect to the pores, or the binning process is causing particles to be missed.
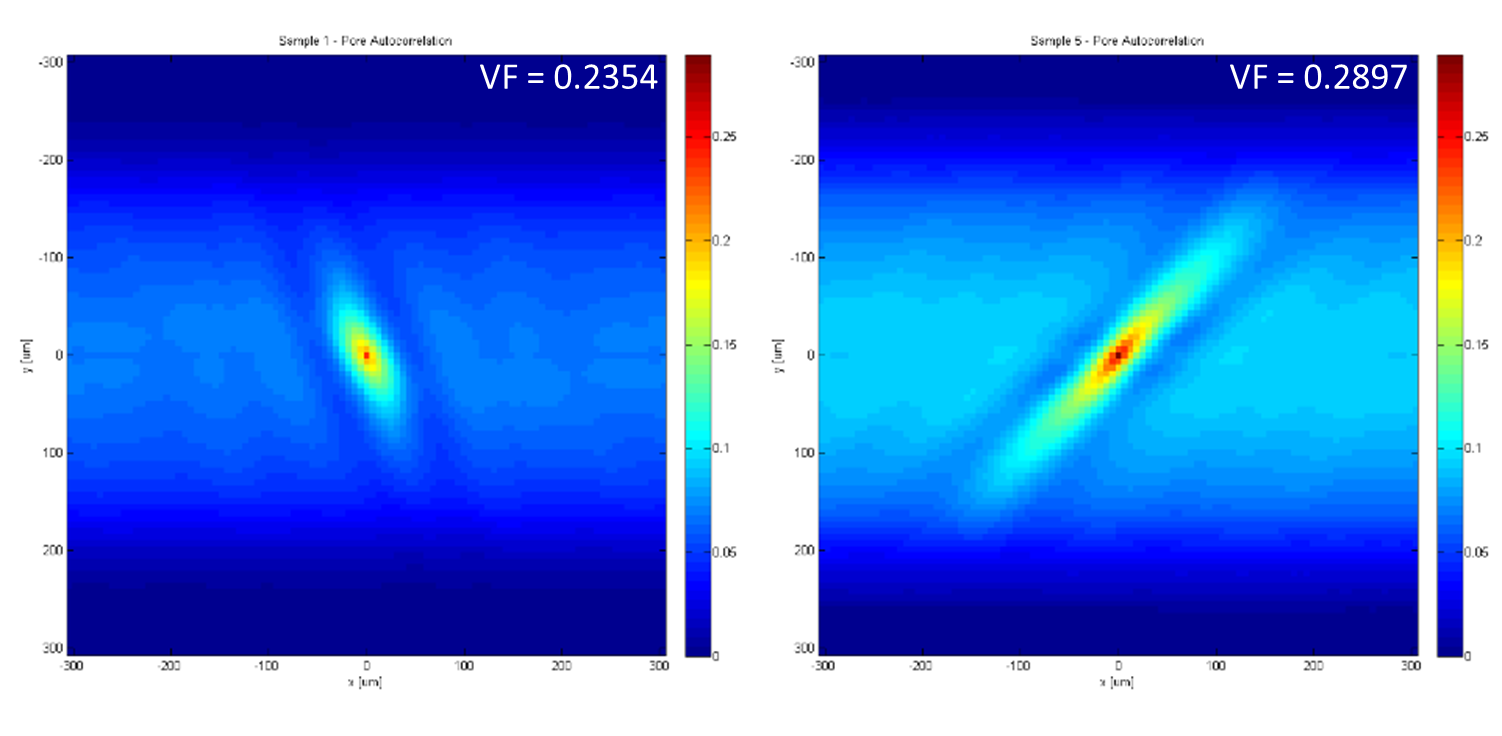 Figure 2
The pore-particle cross correlation also returned an interesting distribution of particles grouping around the pores.
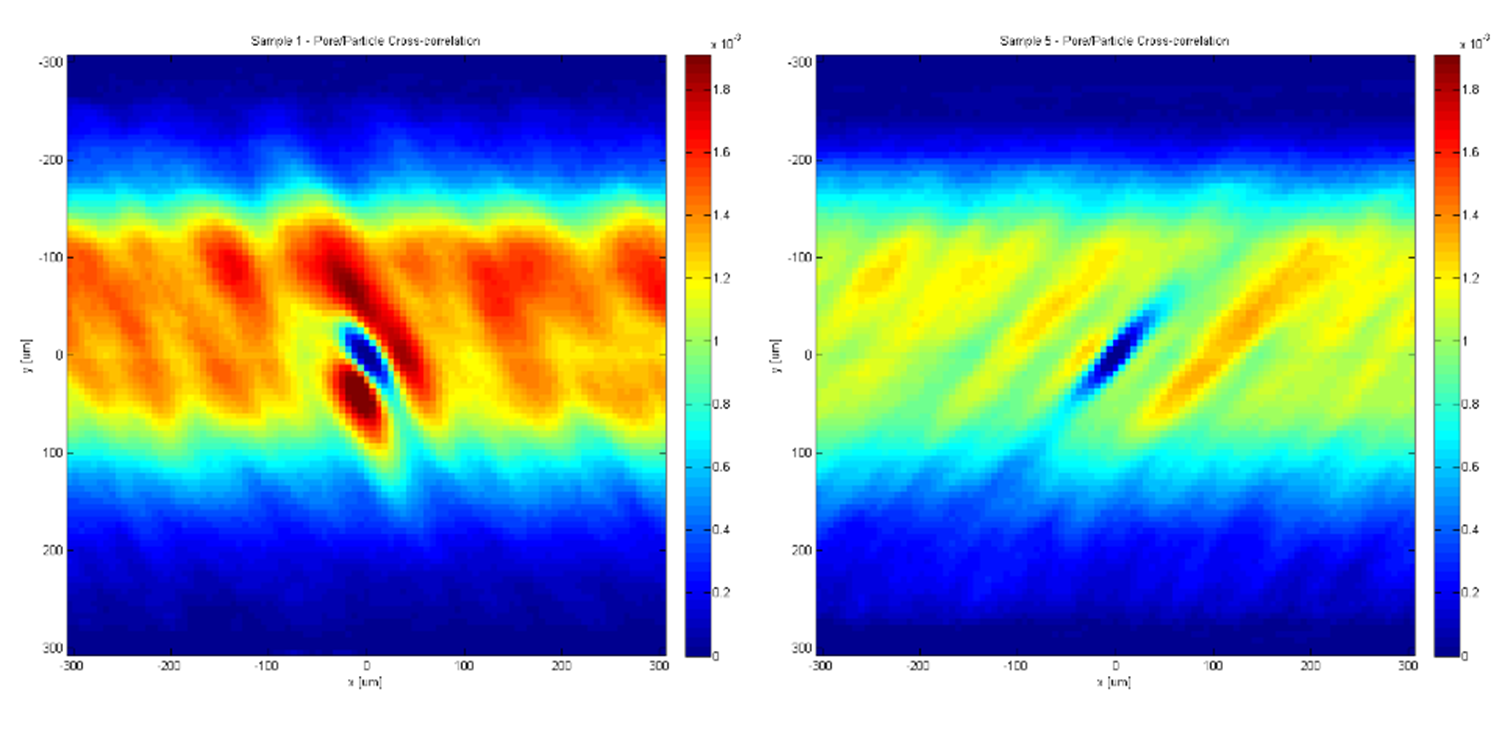 Figure 3
PCA
Using the results from the two-point statistics from 30 simulated sets of data, we built a Principal-Component Analysis. These were the key variances in the datasets:
- Two pore structures: Sample 1 and Sample 5
- Height ratio (h/H)*: 0.5, 1.0, 1.5, 2.0, 2.5
- VF of particles = 0.25%, 0.50%, 0.75%
*If you need a refresher on the Height ratio, see the Process post.
The PCA returned 20 components, and 97.77% of the variance was captured with the first 3 as shown in Figure 4 below.
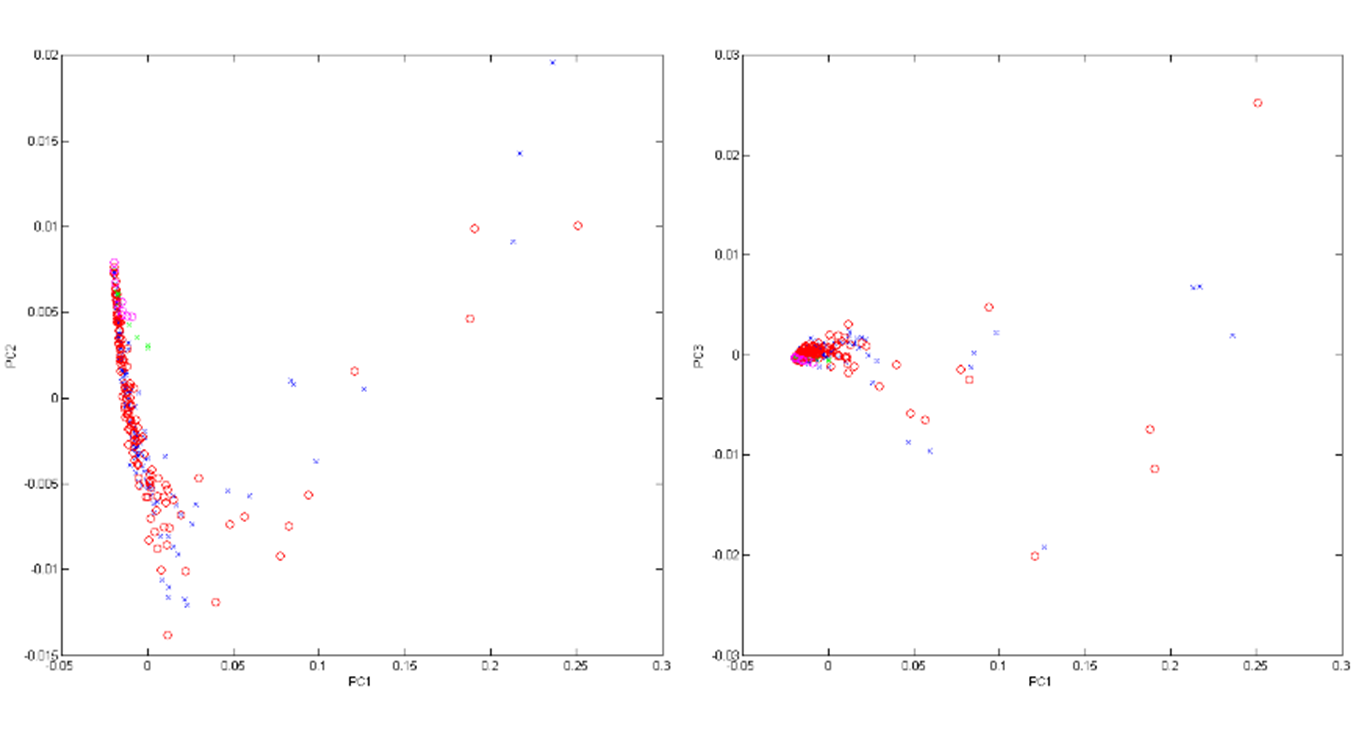
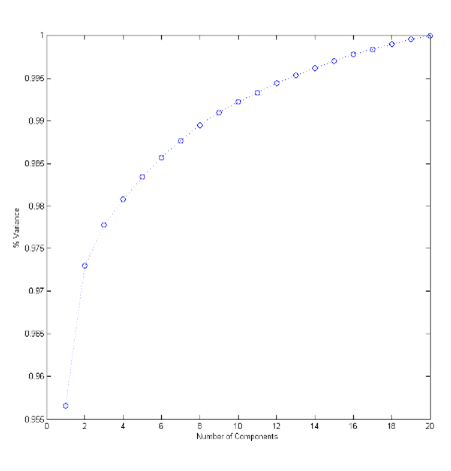 Figure 4
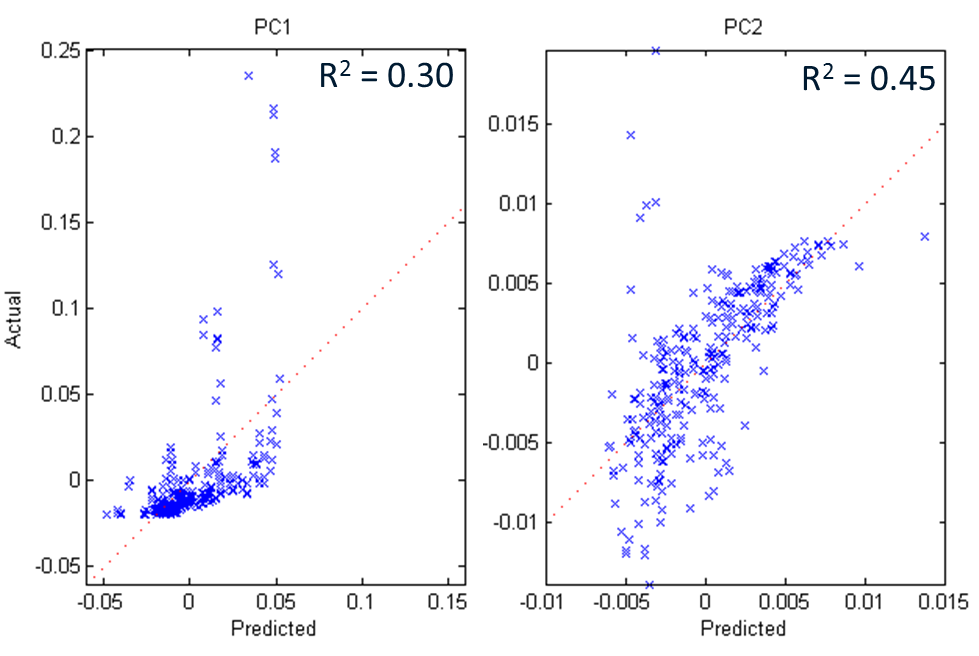
We ran a Regression Analysis on PC1 and PC2 between the set properties of Height, h/H, and VF (including combinations of these up to the 3rd order) and found some rather weak linkages with low Pearson correlations as shown in Figure 5.
Final thoughts:
We were unable to get a strong P-S linkage as we hoped when we started this project, but poor data will often lead to poor results. We learned a lot about the process of coming to one. Hopefully with the knowledge gained from this course and a long list of “What NOT to Do” gathered from this project, a better PCA can be built (using entirely real data, not simulated) and better linkages found.