Last week we gave our final progress report presentation. We had some “more usable but still preliminary” PCA results included in the presentation, however we did not have enough time to color coordinate the various classes in a our plots (our plots were a single monotone color). This post aims to clarify some results and provide some more plots of our PCA values.
Verifying Steady State
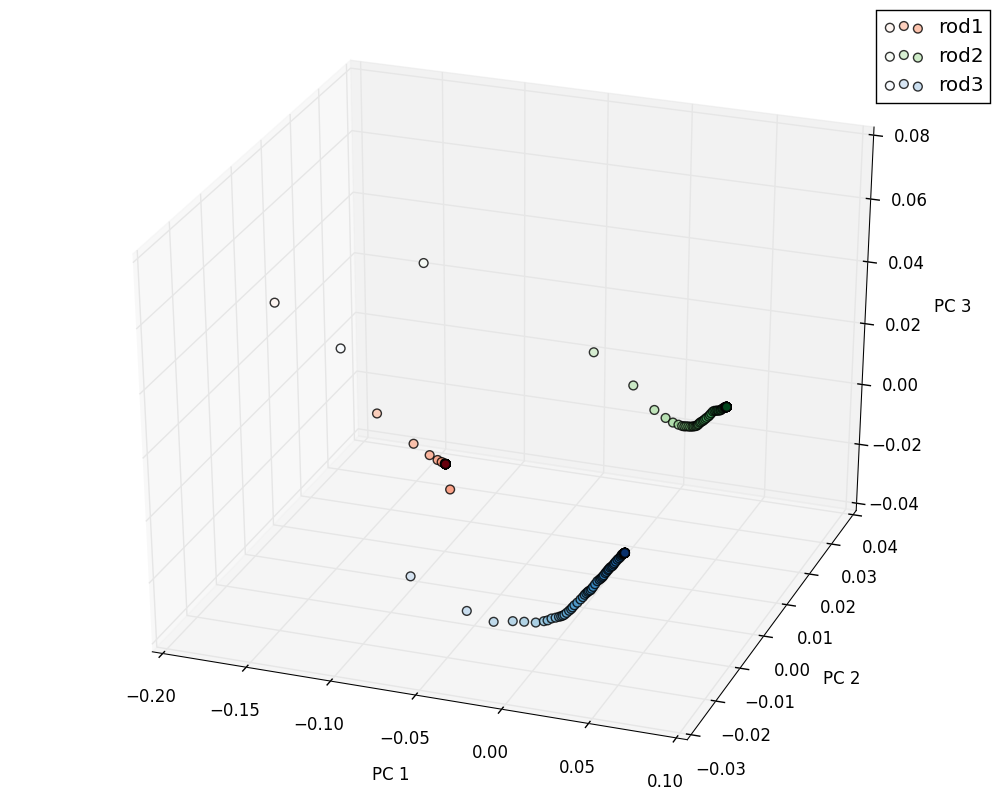
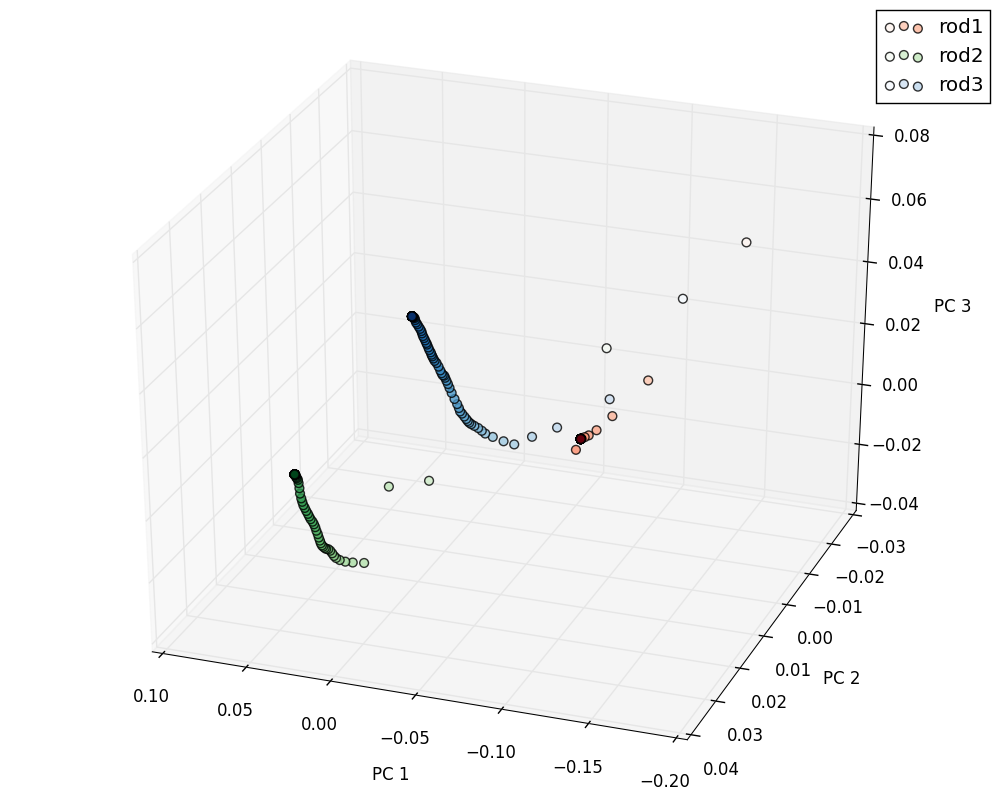
During the presentation last week it was also brought to our attention that we needed to ensure steady state was occurring in our SPPARKS simulations. We ran our SPPARKS simulations for what we thought was a long enough time, but now that we have results we can quantitatively verify that.
So we took our random distribution class and for 100 output files from the beginning to the end of a particular simulation we obtained the chord length distribution each step of the way. We did this for random distribution simulations of rod1, rod2, and rod3 while holding our pin percentage parameter constant. Once plotted in PCA space, all we want to check is that each chord length distribution in time becomes less varied, i.e. we should see convergence of points in PCA space (and hopefully a path to a convergent point). Below is our plot from two different views in 3D.
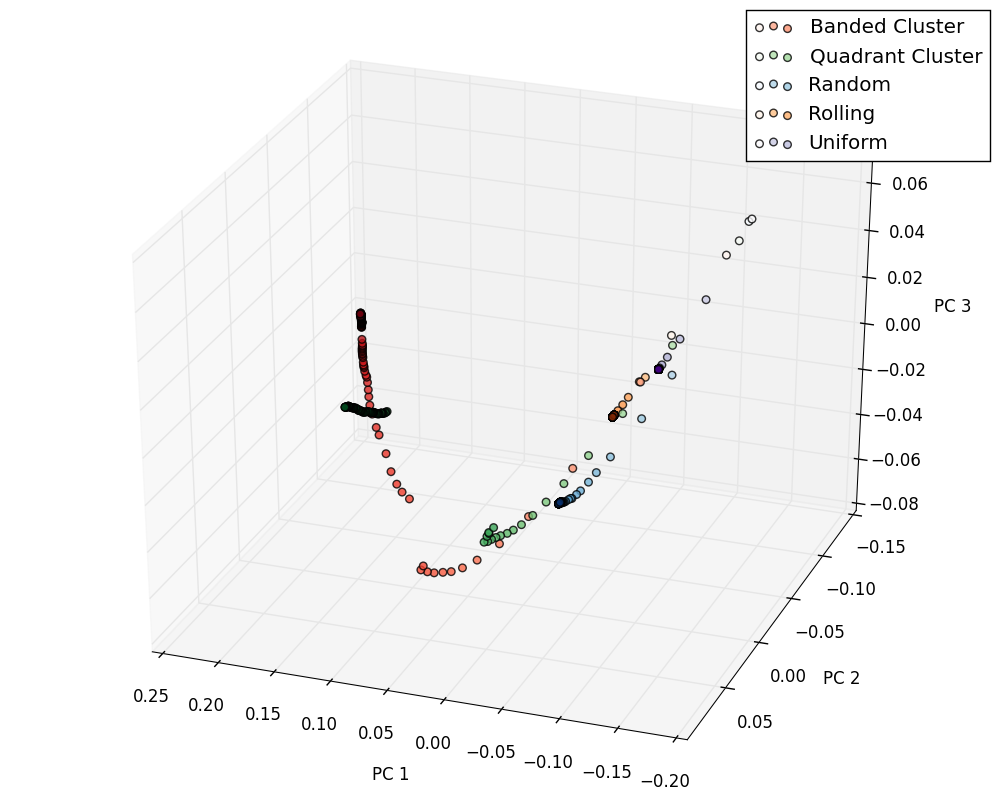
Note that the dots are colored from light to dark as time moves forward. It becomes clear that as time moves forward we are indeed in a steady state, so our results are consistent and correct moving forward.
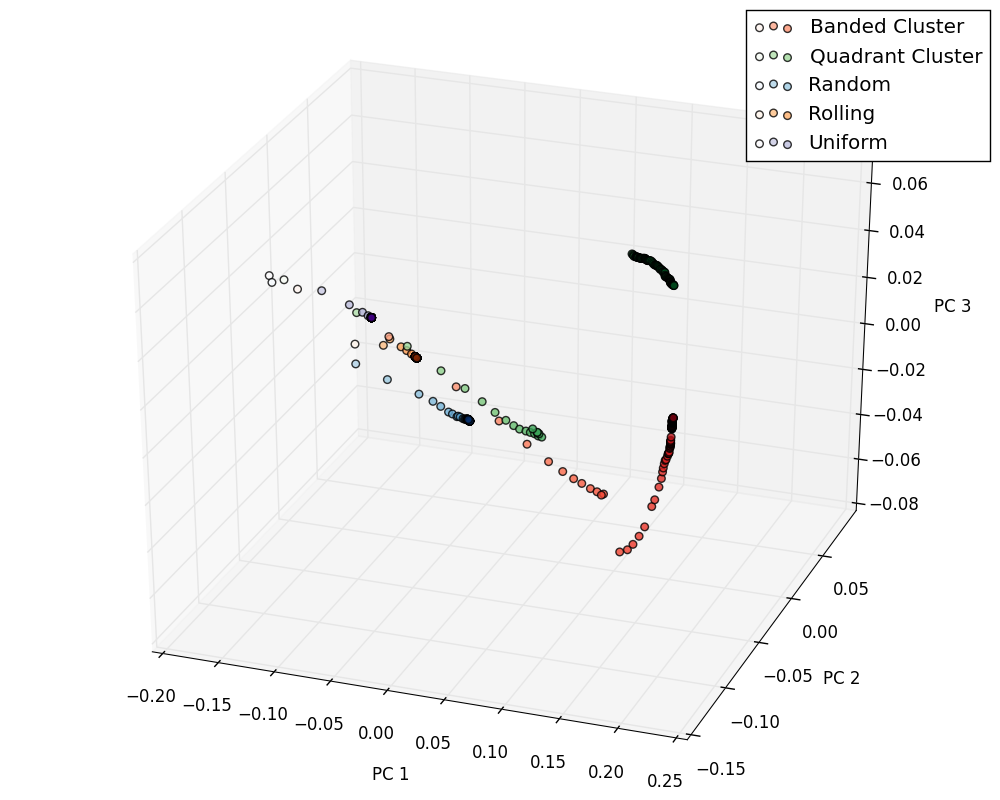
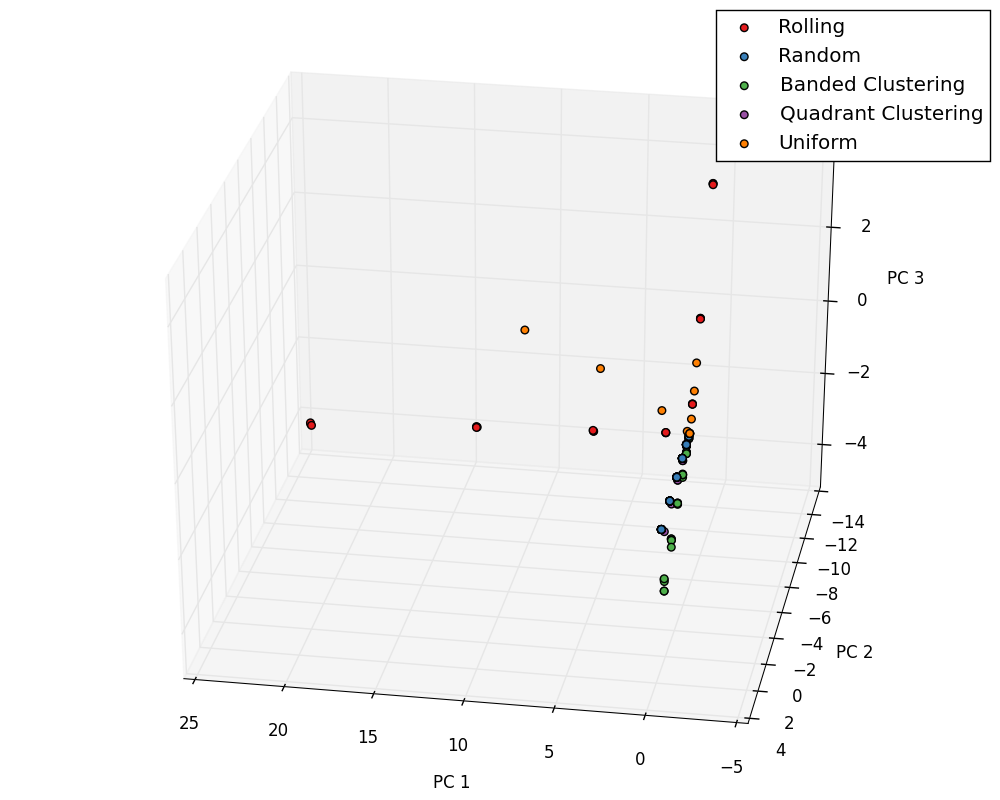
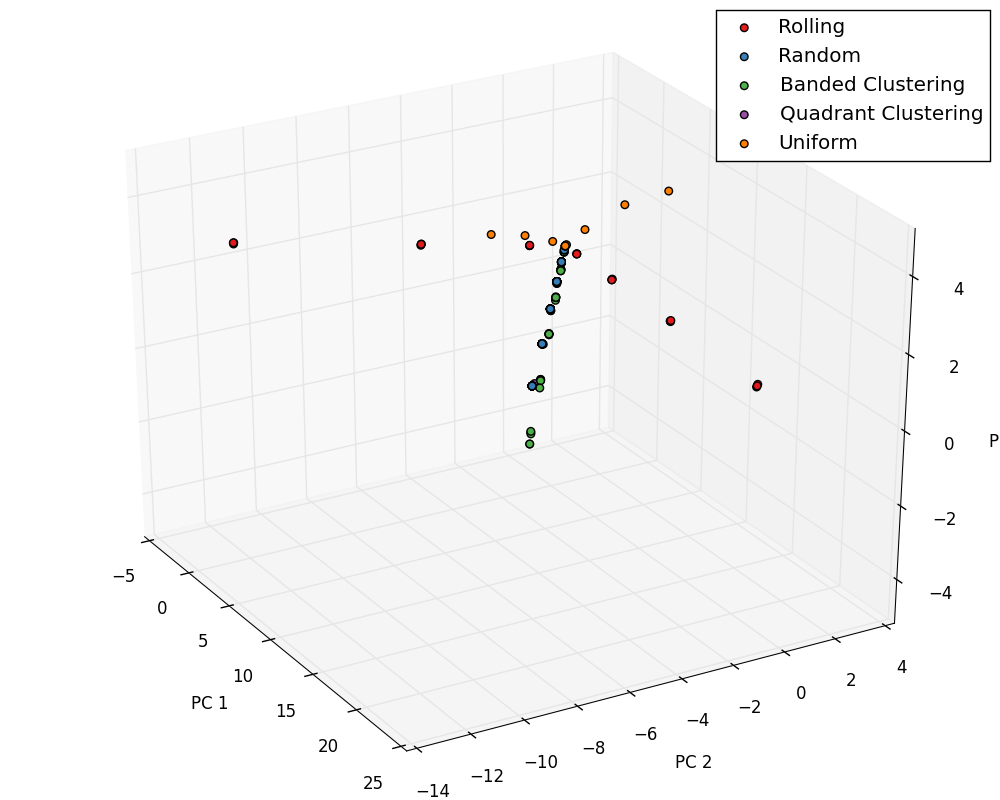
Verifying Pin Shape Effects Chord Length Distribution
Another check we can do is make sure that our different classes converge in PCA space (for a given simulation set of parameters) to distinct points to ensure that pin shape and distribution effects chord length distribution in a meaningful way.
Viewing the plots we can see convergence — looks good!
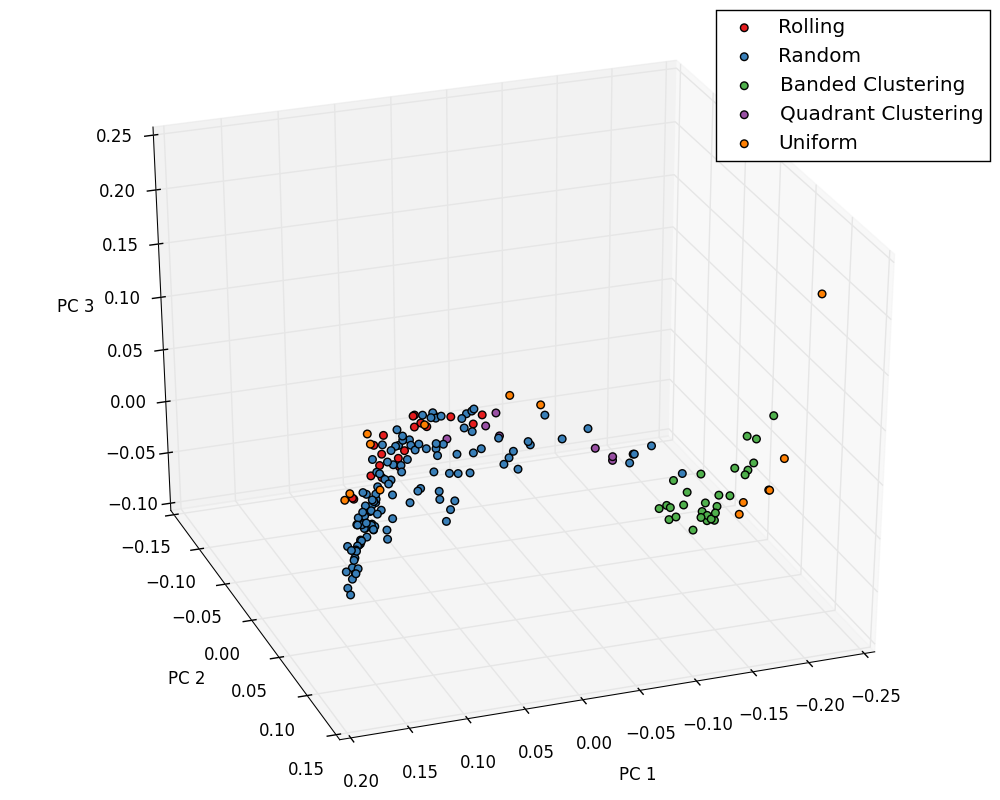
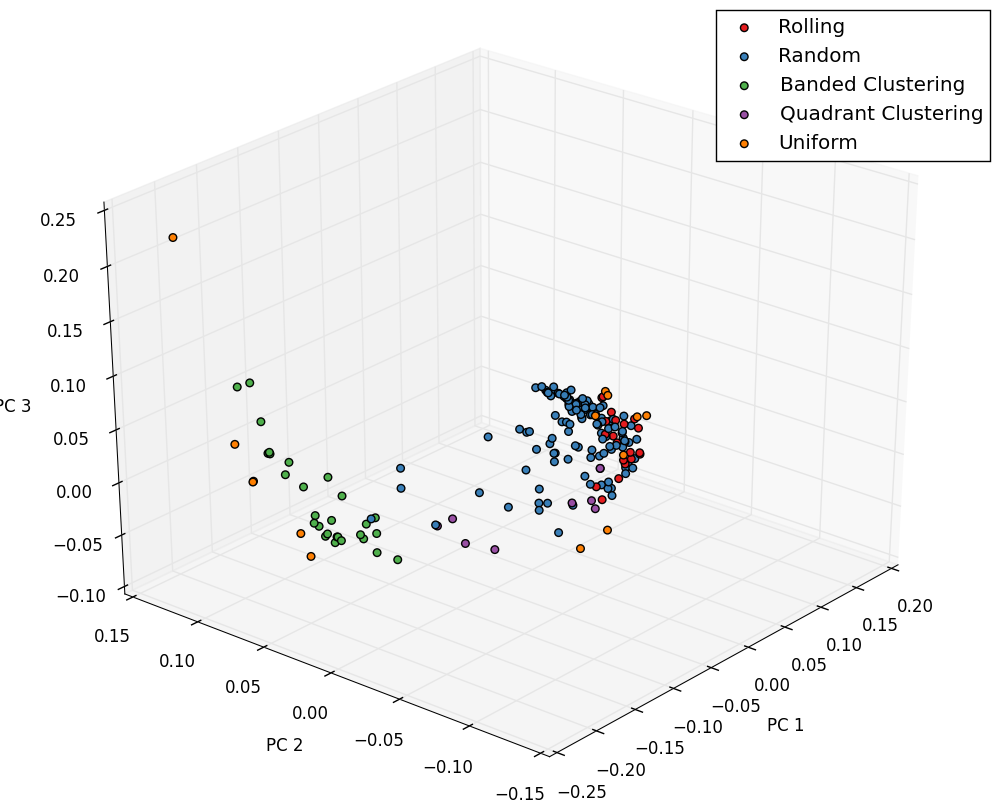
Colored PCA
Finally, below you can find the total input and output plots of our PCA space colored by class. This visualization helps pinpoint what classes produce different chord length distributions.
Input
Output